
Hello traders! Welcome to another blog post where we apply the Elliott wave theory to various financial instruments. Today, we’ll focus on Exxon Mobil (XOM) using the Elliott wave theory. Specifically, we’ll analyze an Elliott wave path from one of our June 2024 updates shared with ElliottWave-Forecast members.
Exxon Mobil (XOM) hit new all-time highs in April 2024, confirming a bullish cycle. However, the Elliott wave provides more precise insights into the XOM trend, as shown in our weekly chart below.
XOM Elliott Wave Analysis – Weekly Chart, 6.23.2024
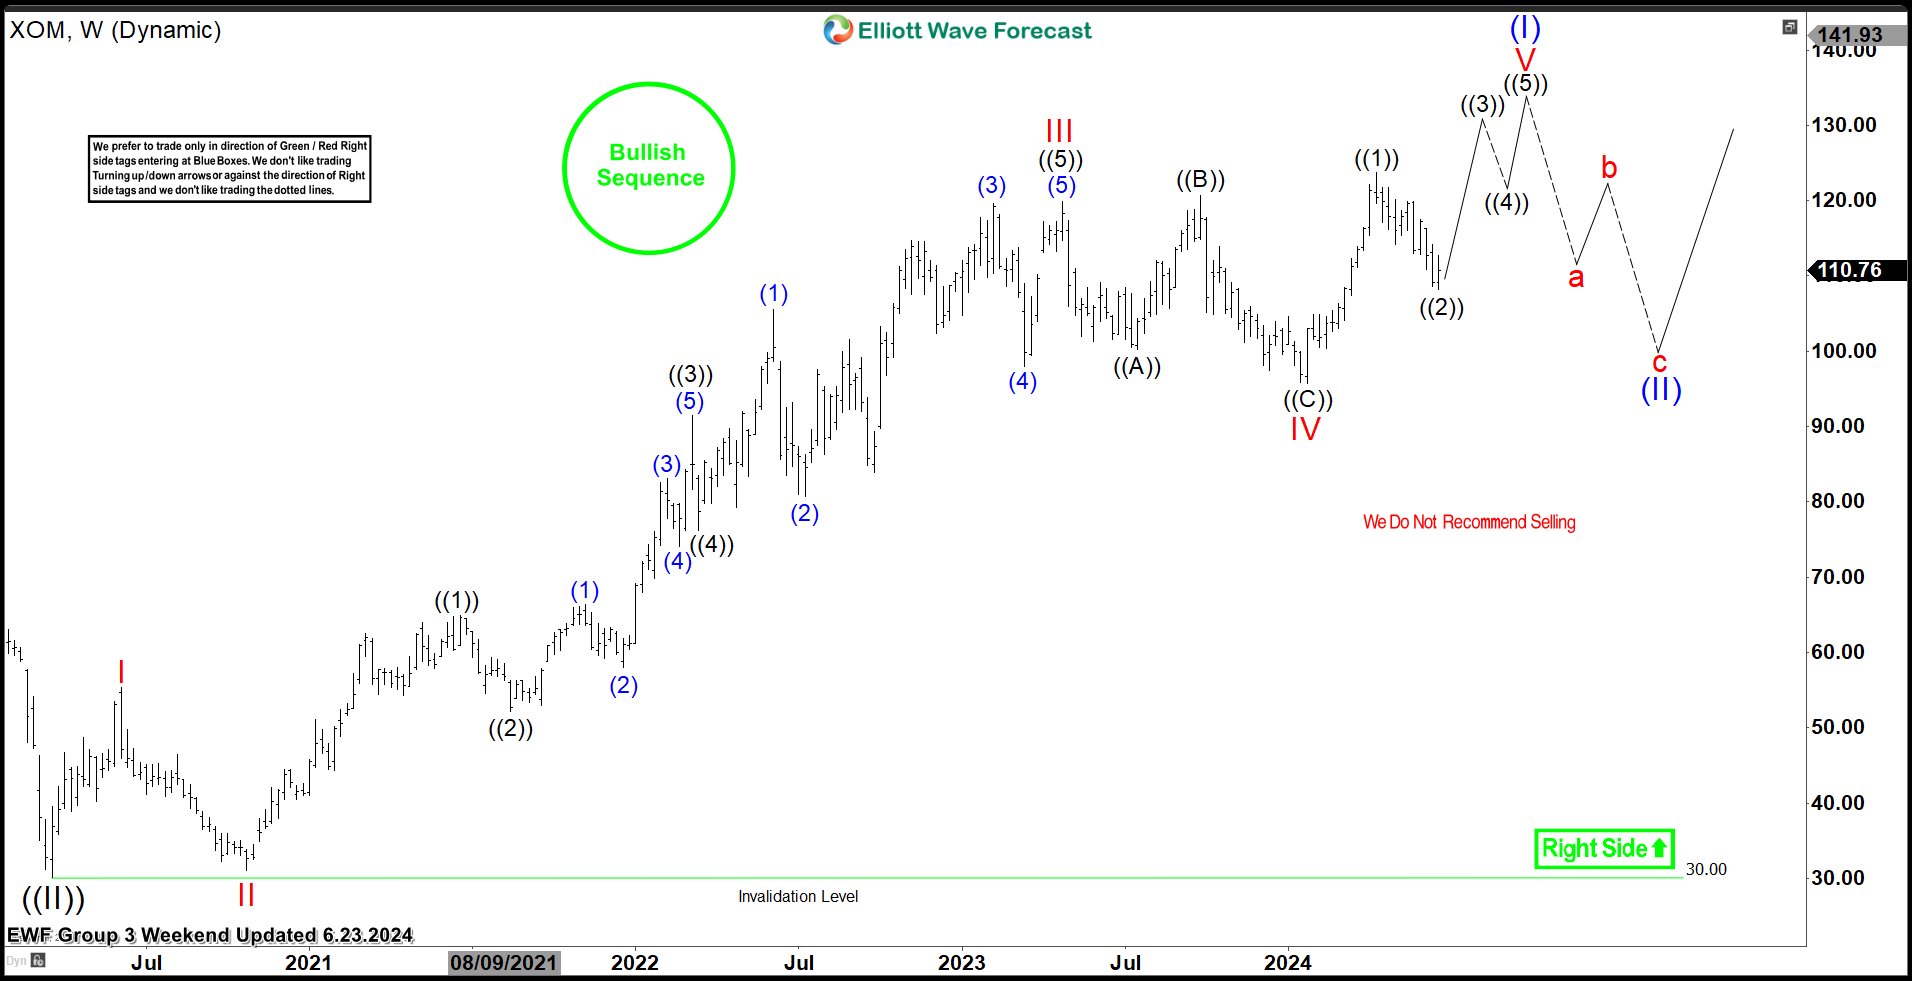
The weekly chart shows XOM in a bullish sequence within wave V of (I) of ((III)) from the 23rd October weekend update. It shows that the price is correcting in wave ((2)) of V. Wave ((1)) reached a fresh all-time high, surpassing the September 2023 high. From this top, the price corrected in wave ((2)) for over two months. We anticipate wave ((3)) will start and lead to another all-time high after breaching the peak of wave ((1)). The best trading strategy is to identify a clear trend and buy dips in a bullish sequence or sell bounces in a bearish sequence. After seeing this chart on June 23, 2024, our members knew to buy the pullback at the extreme of a 3, 7, or 11 swing from the blue box. So, where would we buy? We look for opportunities in the lower time frames.
XOM Elliott Wave Analysis – H4 Chart, 6.10.2024
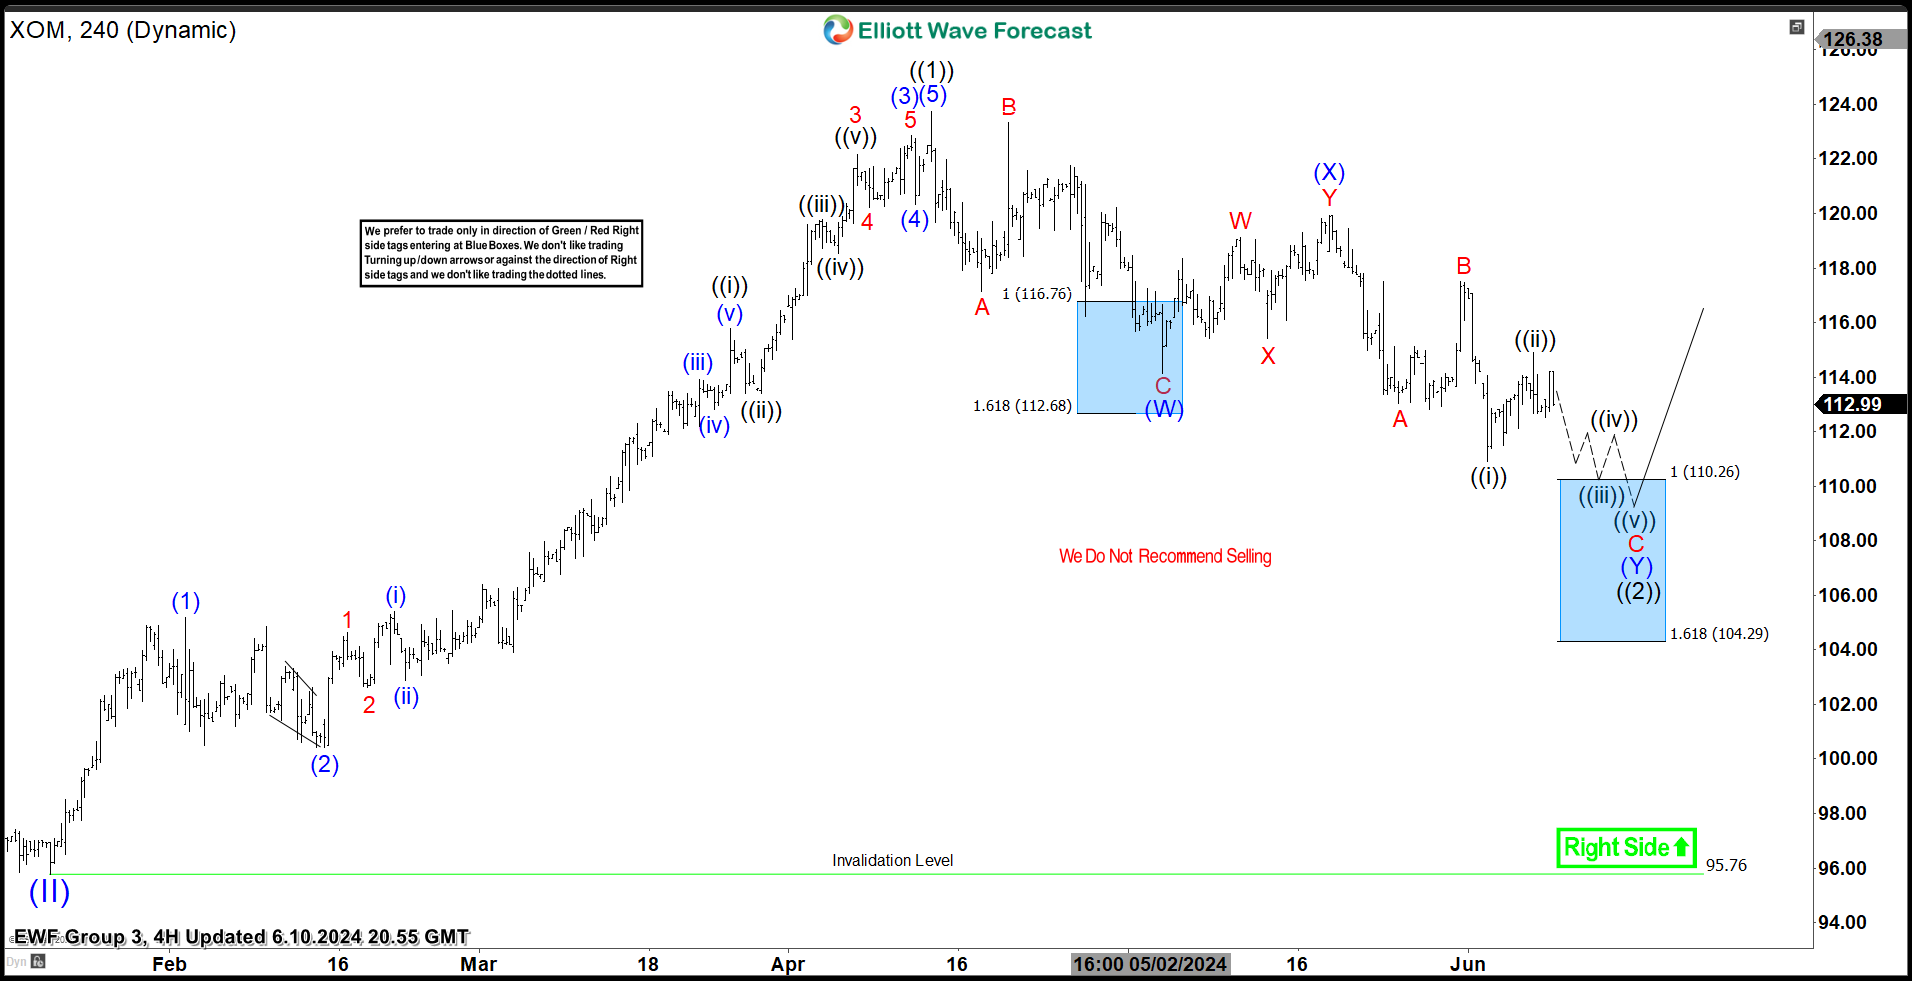
Before the 6.23.2024 weekly chart, we shared the H4 chart above on June 10, 2024, highlighting the blue box. Blue boxes indicate high-frequency areas where markets likely end cycles and turn. In a bullish sequence, we buy pullbacks from the blue box; in a bearish sequence, we sell bounces. Wave ((2)) was in the final stage of a double zigzag structure. We expected wave ((2)) to end at the blue box and find support to start wave ((3)) upwards.
XOM Elliott Wave Analysis – H4 Chart, 6.25.2024
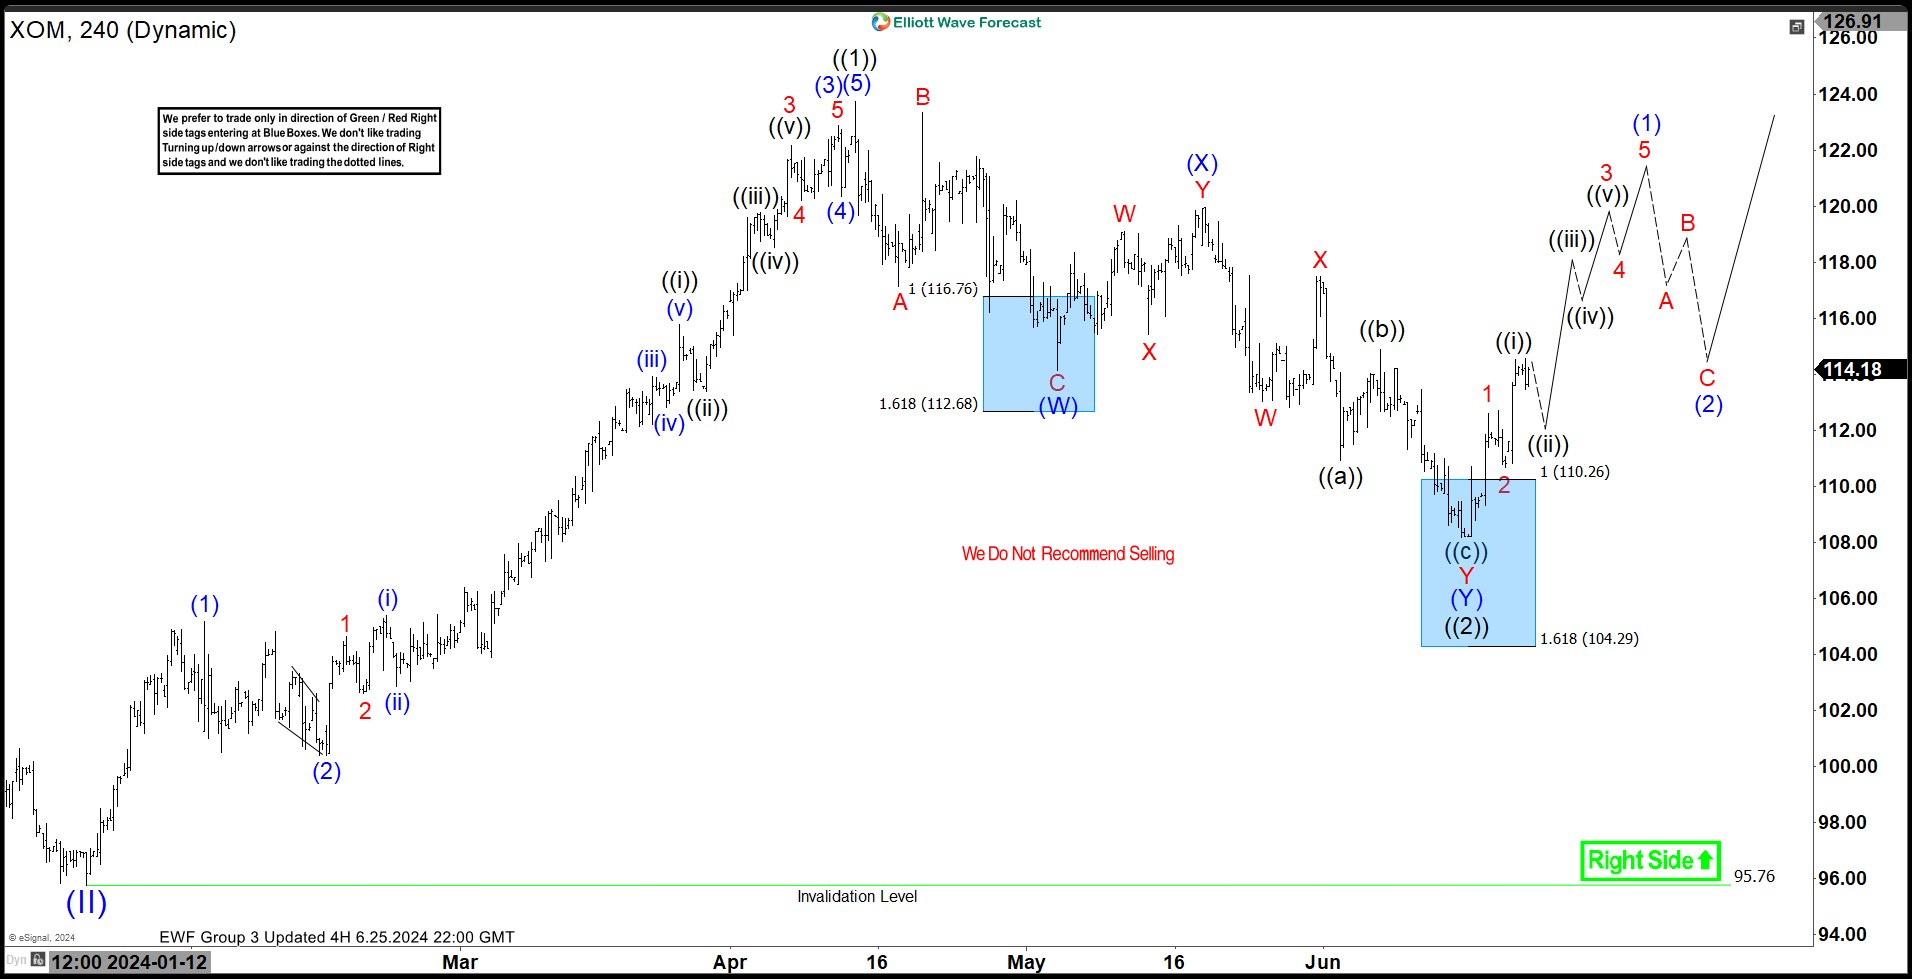
As expected, wave ((2)) found support in the blue box, as shown in the June 25, 2024 H4 chart above. The price is now moving away from the blue box towards a risk-free area where buyers can manage trades and reduce risk. Wave (1) of ((3)) should complete before the next pullback for ((2)). The rally may not be straightforward. However, our analysts will monitor the sub-waves on H1/M30 time frames and share updates with members several times a day.
Source: https://elliottwave-forecast.com/stock-market/xom-found-buyers-at-the-extreme/