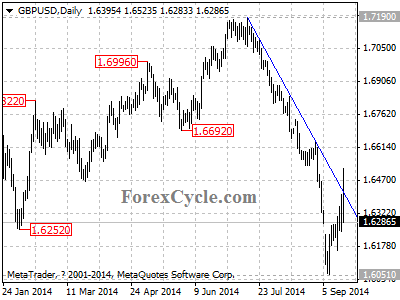
GBPUSD broke above the downward trend line on daily chart, indicating that the downtrend from 1.7190 had completed at 1.6051 already. Range trading between 1.6051 and 1.6700 would likely be seen over the next several weeks. Resistance is at 1.3700, as long as this level holds, the downtrend could be expected to resume, and another fall towards 1.5000 is still possible.