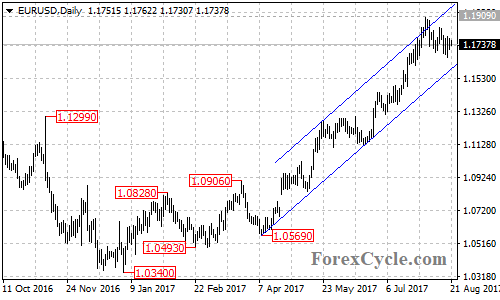
EURUSD stays in a bullish price channel on its daily chart and remains in the uptrend from 1.0569. As long as the price is in the channel, the pullback from 1.1909 could be treated as consolidation of the uptrend.

On the 4-hour chart, the EURUSD pair ran in a falling price channel, so deeper decline is still possible in a couple of days and the target would be at the bottom trend line of the channel on its daily chart now at around 1.1590.
On the upside, the price could be expected to test 1.1909 resistance after the consolidation. A break of this level could signal resumption of the uptrend, then next target would be at the 50% retracement taken from the May 2014 high of 1.3993 to the January 3 low of 1.0340 at around 1.2165, followed by 1.2700.
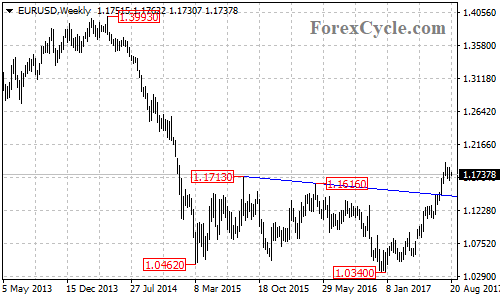
The pair formed a double bottom pattern on its weekly chart with a measured move target at around 1.2700. This would be the final target for the bullish movement.

On the downside, a clear break below the bottom support trend line of the price channel on the daily chart will indicate that lengthier consolidation for the uptrend is needed, then the pair would find next support level at around 1.1430.
There is a resistance-turned-support trend line on the weekly chart from 1.1713 to 1.1616 with support at around 1.1430, only a clear break below this support trend line could signal completion of the uptrend.
Technical levels
Support levels: 1.1590 (the bottom trend line of the price channel on the daily chart), 1.1430 (the resistance-turned-support trend line on the weekly chart).
Resistance levels: 1.2165 (the 50% retracement), 1.2700 (the measured move target).

