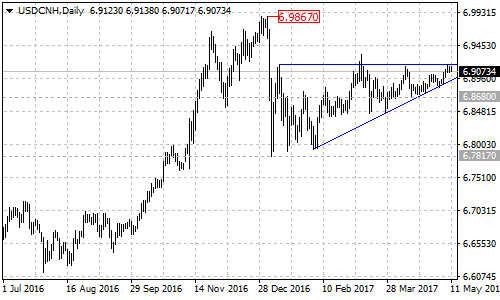
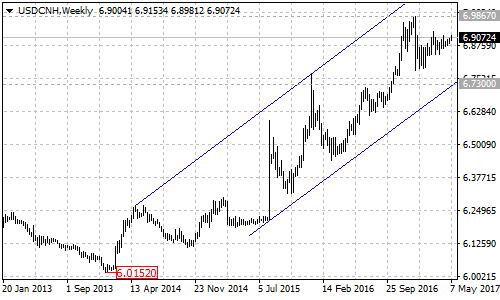
USDCNH is in long term uptrend from 6.0152 (Jan 14, 2014 low). The highest record of this bullish movement is 6.9867 (Jan 3 high). After a sharp drop to 6.7817, the pair formed an ascending triangle pattern on daily chart. The triangle pattern could be treated as a part of the consolidation stared from 6.9867.

All we can do now is wait for the breakout to occur to identify the following trend of this currency pair. This breakout is either above the horizontal trend line resistance or below the ascending trend line support. Here is a trading trategy for triangle pattern.
Breaking out of the upper line of the triangle pattern
The ascending triangle pattern is often regarded as a breakout above resistance line on completion. A break of the resistance line will suggest that the pair remains in the uptrend from 6.7817. This will trigger a bullish movement towards 7.1200.
Breaking below the bottom line of the triangle pattern
The breakout can take place below the resistance pattern too. If this happen, the following downward movement could bring price back below 6.7817 support. However, confirmation is needed for this case. There is a key support located at 6.8680. Only a breakdown below this level will confirm that a bearish movement has started.
The target of the bearish movement
We notice that the USDCNH pair is running in a rising price channel on the weekly chart, and the long term bullish structure remains in good condition. The bottom of the channel could limit the bearish movement well, and the support level is now around 6.7300.

Technical levels
Support levels: The bottom support line of the triangle pattern on daily chart, 6.8680 (the key support), 6.7817 (Jan 5 low), 6.7300 (the bottom line of the price channel on weekly chart).
Resistance levels: The top resistance line of the triangle pattern on daily chart, 6.9867 (Jan 3 high), 7.1200 (measured move target).

