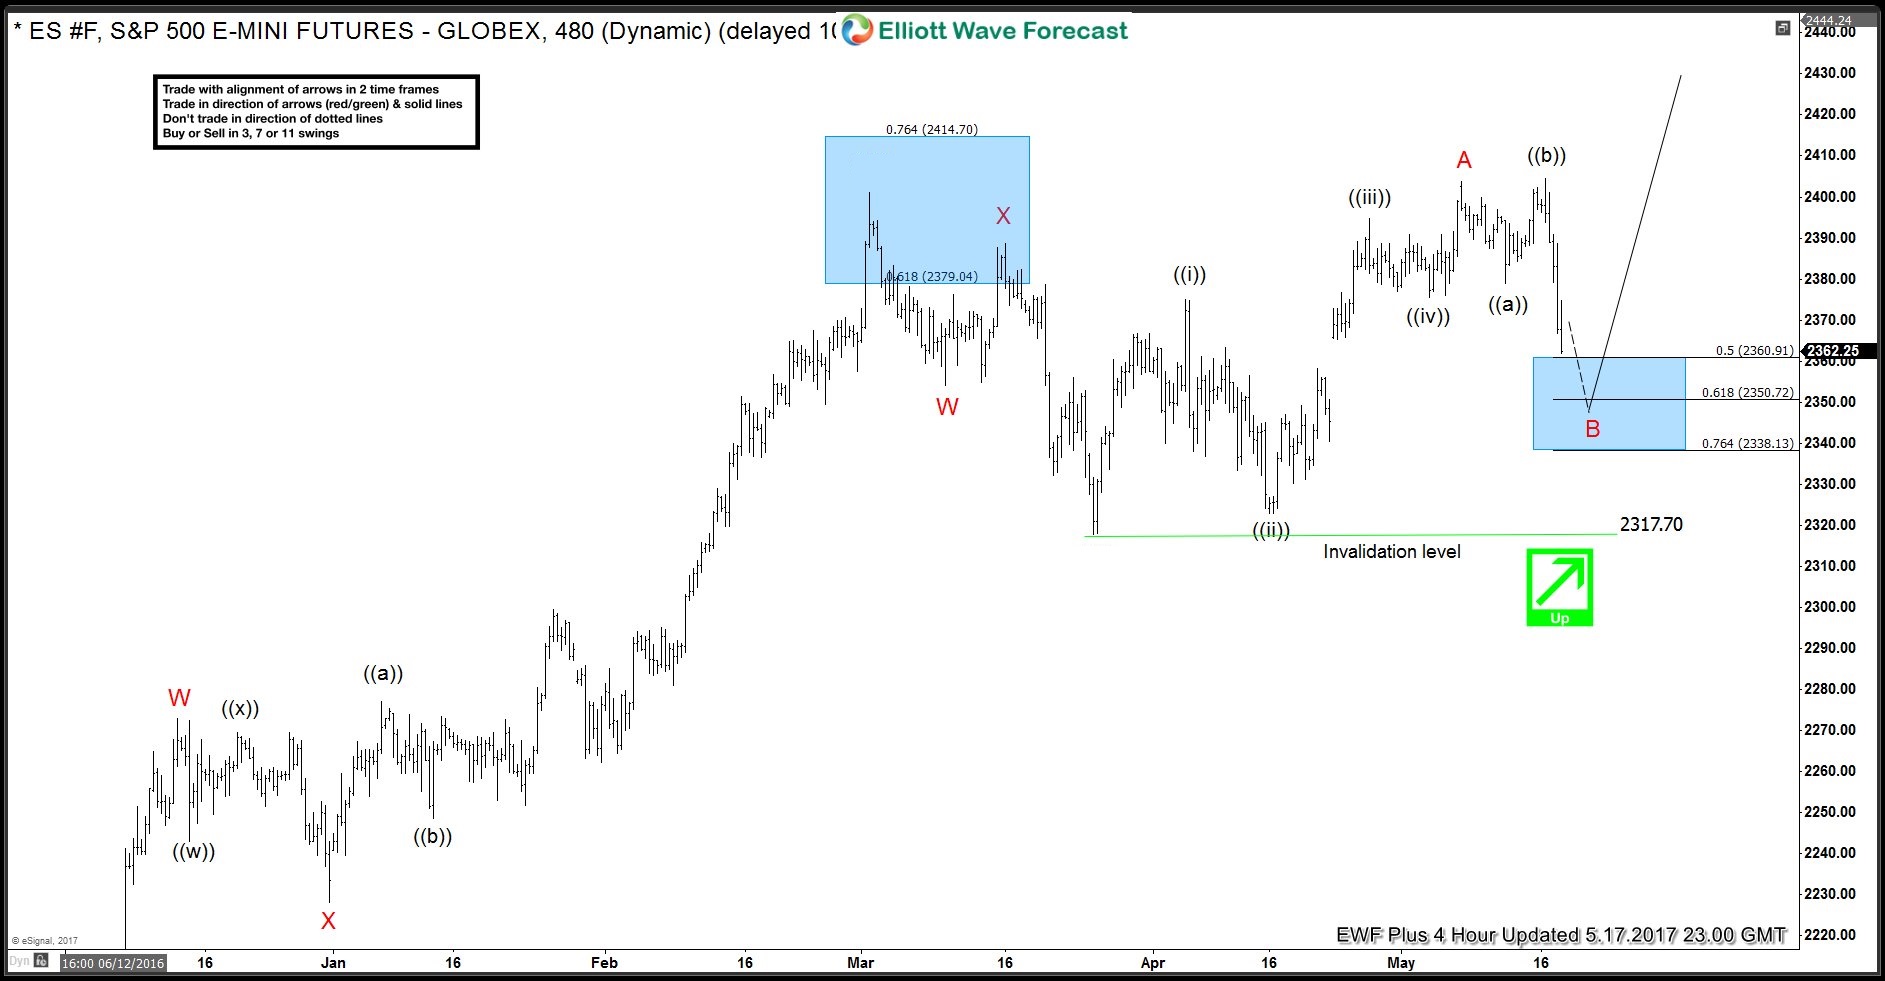
In this technical blog we’re going to take a look at the past Elliott Wave charts of $ES_F (S&P 500) and explain Elliott Wave Flat structure. As our members know, we were pointing out that $ES_F (S&P 500) is within bullish trend. Price structure has been calling for more strength once B red pull back completes as Expanded flat at 2360-2338 area. Consequently, we recommended our members to avoid selling it and keep going with the trend-buying the dips. The chart below is $ES_F (S&P 500) 4 hour chart from 05.17.2017.
$ES_F (S&P 500) Elliott Wave Expanded Flat
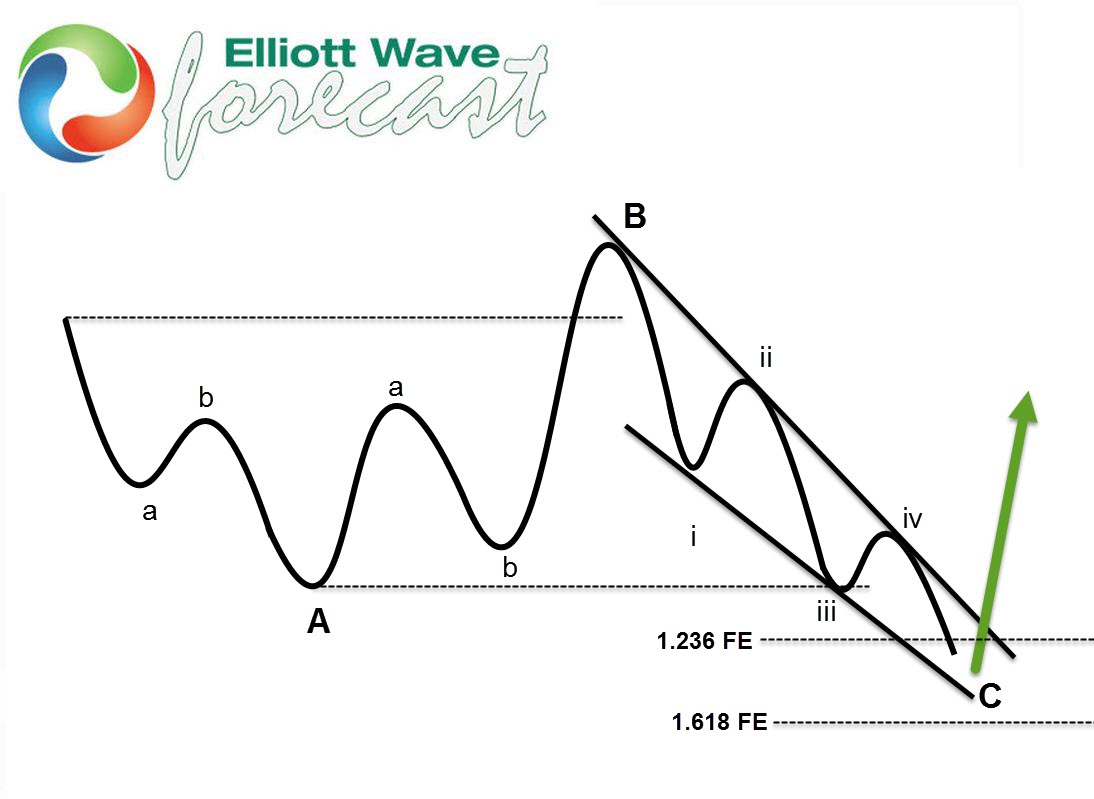
Before we take a look at the short term structure, let’s explain expanded flat in a few words.
Expanded Flat is a 3 wave corrective pattern which could often be seen in the market nowadays. Inner subdivision is labeled as A,B,C , with inner 3,3,5 structure. Waves A and B have forms of corrective structures like zigzag, flat, double three or triple three. Third wave C is always 5 waves structure, either motive impulse or ending diagonal pattern. It’s important to notice that in Expanded Flat Pattern wave B completes below/above the start point of wave A , and wave C ends above/below the ending point of wave A which makes it Expanded. Wave C of expanded completes usually close to 1.236 Fibonacci extension of A related to B, but sometimes it could go up to 1.618 fibs ext
Now let’s see what this pattern looks like in real market example.
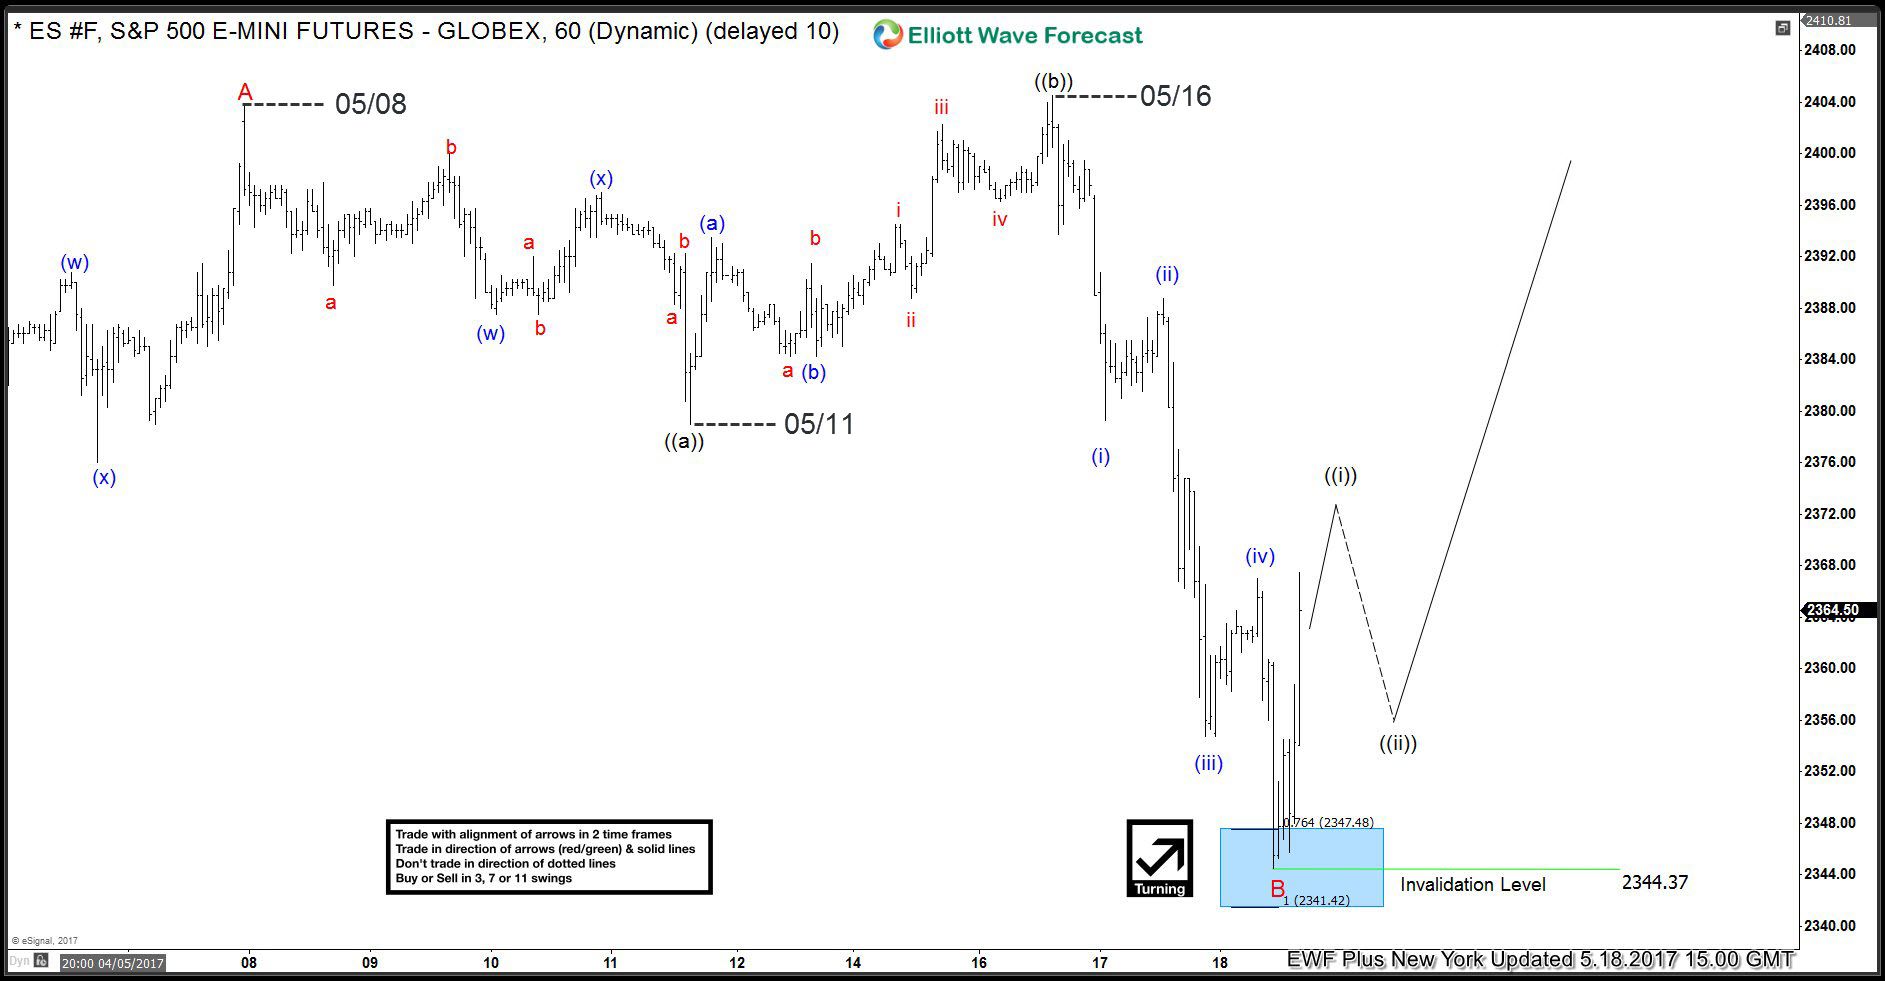
$ES_F (S&P 500) 1 Hour chart: 5/18/2017
We can see that wave B has unfolded as Expanded Flat, when waves ((a)) and ((b)) are 3 waves structures, while wave ((c)) is 5 waves. Wave ((b)) has broken above starting point of Flat and wave ((c)) got extended to the downside making this correction Expanded Flat. Although ((c)) got extended, B red pull back ended right at proposed area 2360-2338 ( referring to 4 hour chart above).
As far as the price stays above 2344.37 low, we’re calling wave B red pull back completed there
Source : https://elliottwave-forecast.com/stock-market/sp500-made-new-high


