Hello fellow traders. In this technical blog we’re going to take a quick look at the past Elliott Wave charts of Copper published in members area of www.elliottwave-forecast.com. In further text we’re going to count the swings, explain the short term Elliott Wave view.
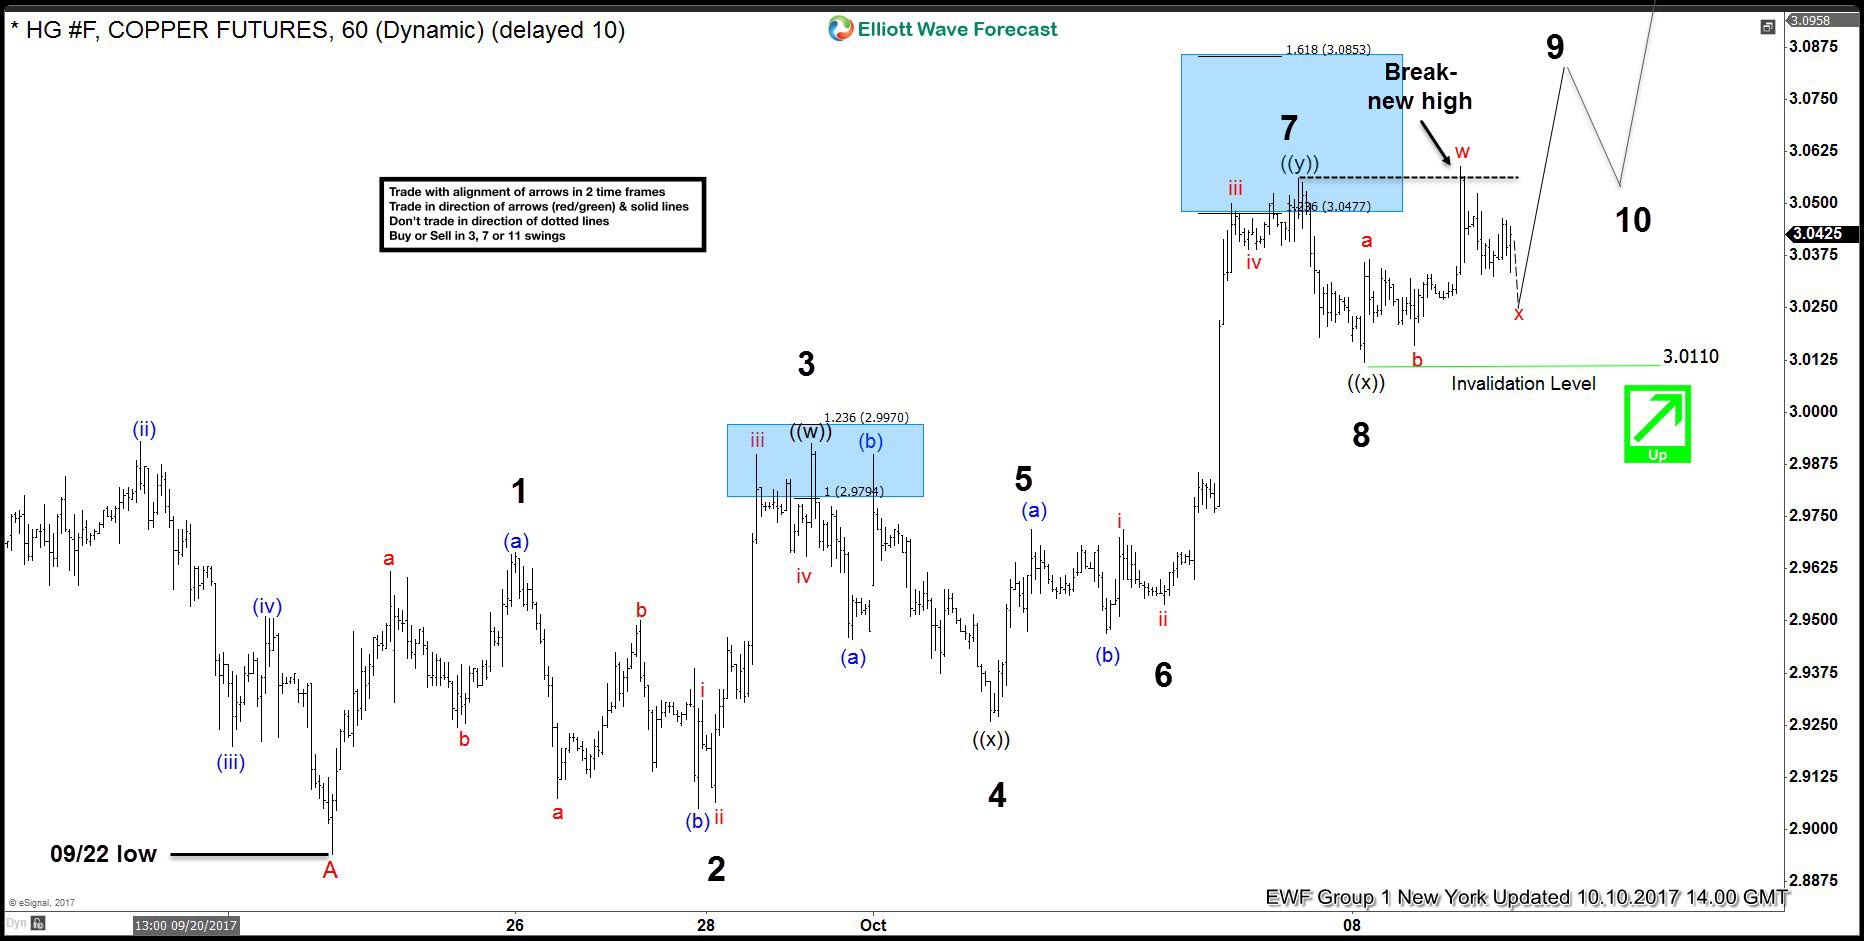
Copper Elliott Wave 1 Hour Chart 10.10.2017
As our members know, Copper has had incomplete bullish sequences in larger time frames targeting 3.363 area. Consequently, we advised members to avoid selling and keep buying the dips in 3,7,11 swings. On 9th October Copper has made new short term high that made sequences bullish in the short term cycle as well. With new high we assumed that 9th swing is in progress. That means short term cycle from the 09/22 low is also having incomplete sequences . As of right now, 11th swings up are required to complete proposed cycle.
We’re labeling proposed cycle as a Triple Three structure. Second ((x)) connector is counted completed at 3.011 low and we’re about to complete short term x red pull back. As far as the mentioned level holds, we expect further rally.
Shortly after Copper found buyers , and make further separation from the 3.011 low, eventually breaking above 09/04 peak. Keep in mind market is very dynamic. If you’re interested in new Elliott Wave forecasts of Copper you can find them in the membership area of EWF.
Source : https://elliottwave-forecast.com/commodities/copper-swings-sequences-calling-rally/


