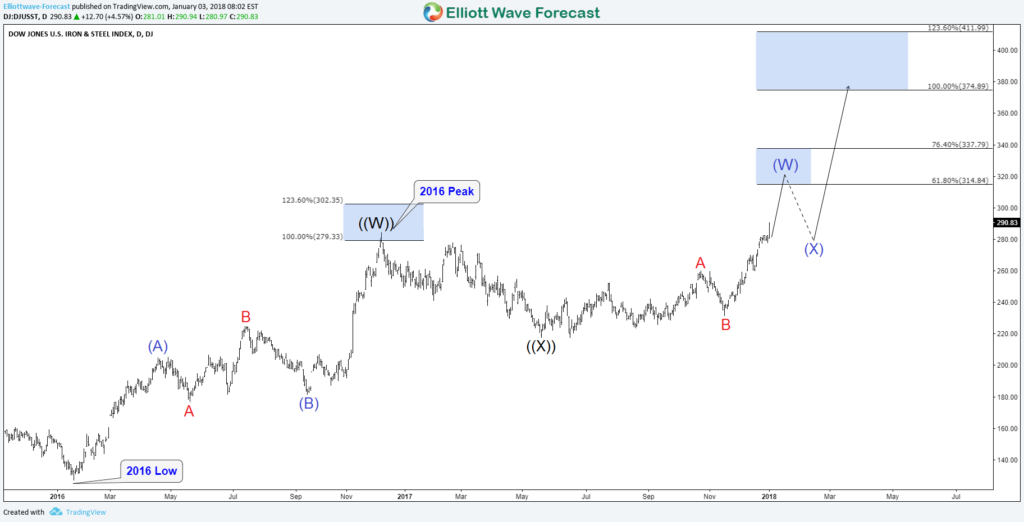
Last month, Dow Jones Iron & Steel Index DJUSST managed to break above December 2016 peak and created an incomplete bullish sequence from 2016 low calling for a move higher toward equal legs area $374 -$411. In the daily chart, we can see that the move higher was expected to pullback from the 61.8% – $76.4 fib ext area before resuming the trend to the upside.
DJUSST Daily Chart 01/03/2018
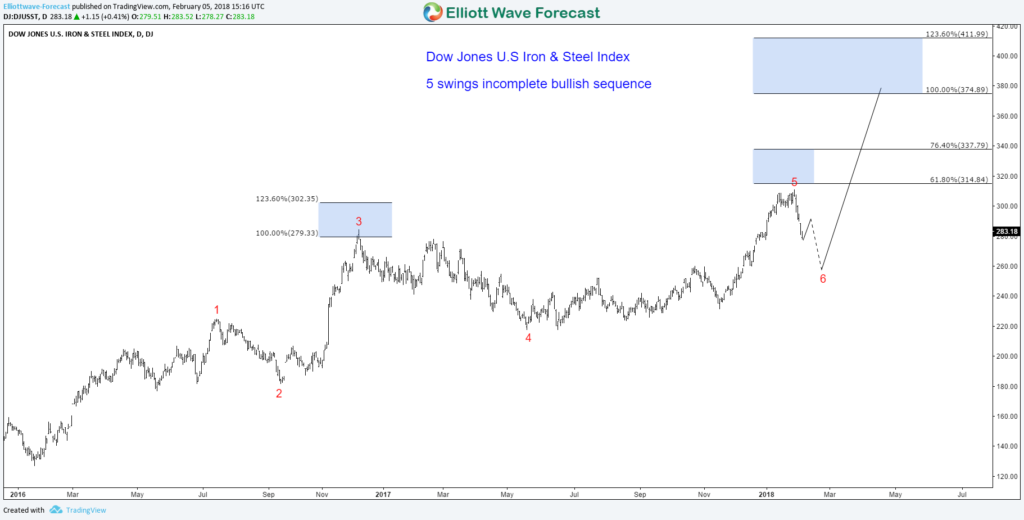
In the next chart, we can notice that DJUSST already ended the 5 swings higher slightly below the 61.8 % area and started the 6th swing pullback which we expect to find buyers in 3, 7 or 11 swings against June 2017 low then it will resume higher or bounce in 3 waves at least.
DJUSST Daily Chart 02/05/2018
Recap
Dow Jones Iron & Steel Index DJUSST is showing an incomplete 5 swings bullish sequence from 2016 low and expected to hold above June 2016 low. Any related stock to Iron & Steel will remain supported in 2018 until it ends the cycle from 2016.
Source : https://elliottwave-forecast.com/stock-market/djusst-bullish-sequence/


