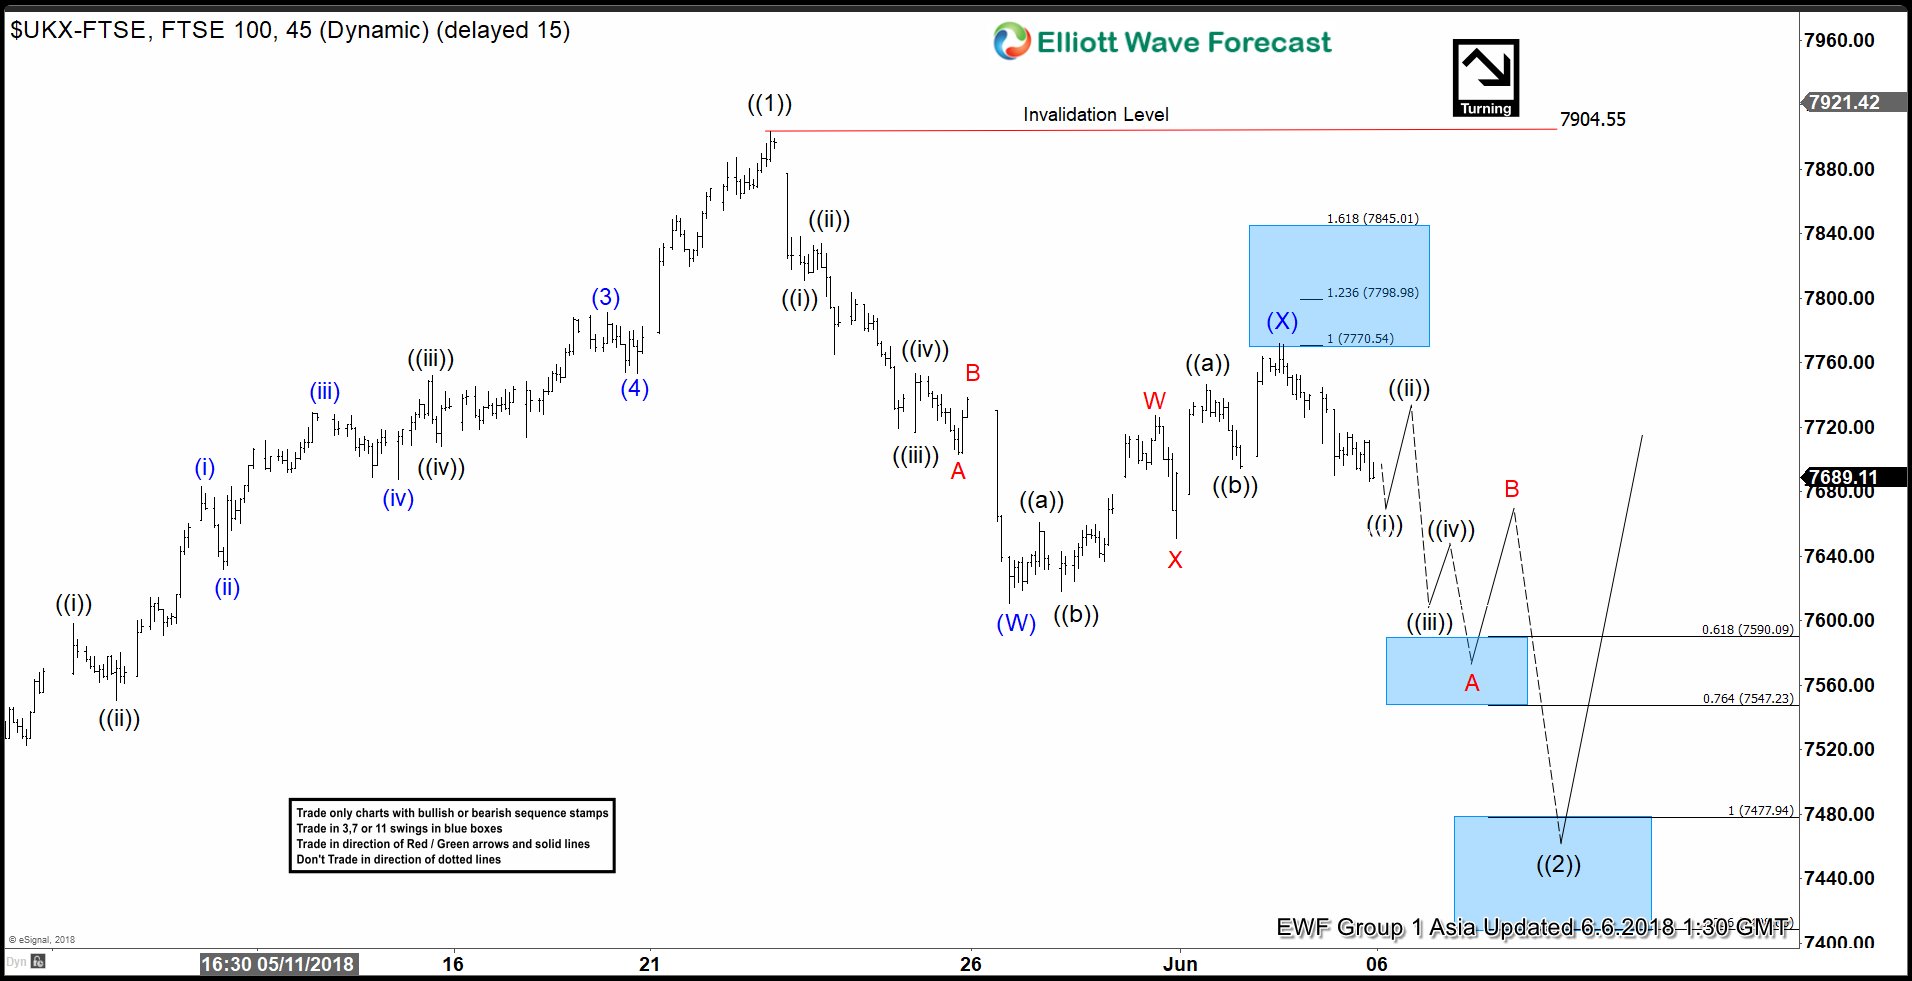
FTSE short-term Elliott wave view suggests that the rally to 7903.50 high on 5/22/2018 peak ended primary wave ((1)). This rally to 7903.5 starts from 3/23/2018 low and took the form of an impulse Elliott wave structure. The index is currently in Primary wave ((2) pullback to correct cycle from 3/23/2018 low.
So far the decline from the peak shows an overlapping internal structure, suggesting the index is pulling back in corrective sequence i.e either as W,X,Y or W,X,Y,X,Z structure. Down from 7903.5 high, the decline to 7610.66 low ended the first leg of the pullback in Intermediate wave (W). The internals of Intermediate wave (W) unfolded as Elliott wave Zigzag structure where Minor wave A ended at 7703.26, Minor wave B ended at 7738.46, and Minor wave C of (W) ended at 7610.66.
Above from 7610.66, the bounce to 7772.12 high ended Intermediate wave (X). The internals of Intermediate wave (X) unfolded as Elliott wave double three structure where Minor wave W ended at 7727.45, Minor wave X ended at 7651.412, and Minor wave Y of (X) ended at 7772.12. Near-term, while below 7772.12 Intermediate wave (X) high, expect the Index to extend lower in Intermediate wave (Y). Intermediate wave (Y) should see more downside towards 7477.94-7408.77, which is 100%-123.6% Fibonacci extension area of Intermediate wave (W)-(X). This move lower should also end Primary wave ((2)) pullback & Index should resume higher again. We don’t like selling the index.
FTSE 1 Hour Elliott Wave Chart
Source : https://elliottwave-forecast.com/stock-market/elliottwave-ftse-buying-opportunity/


