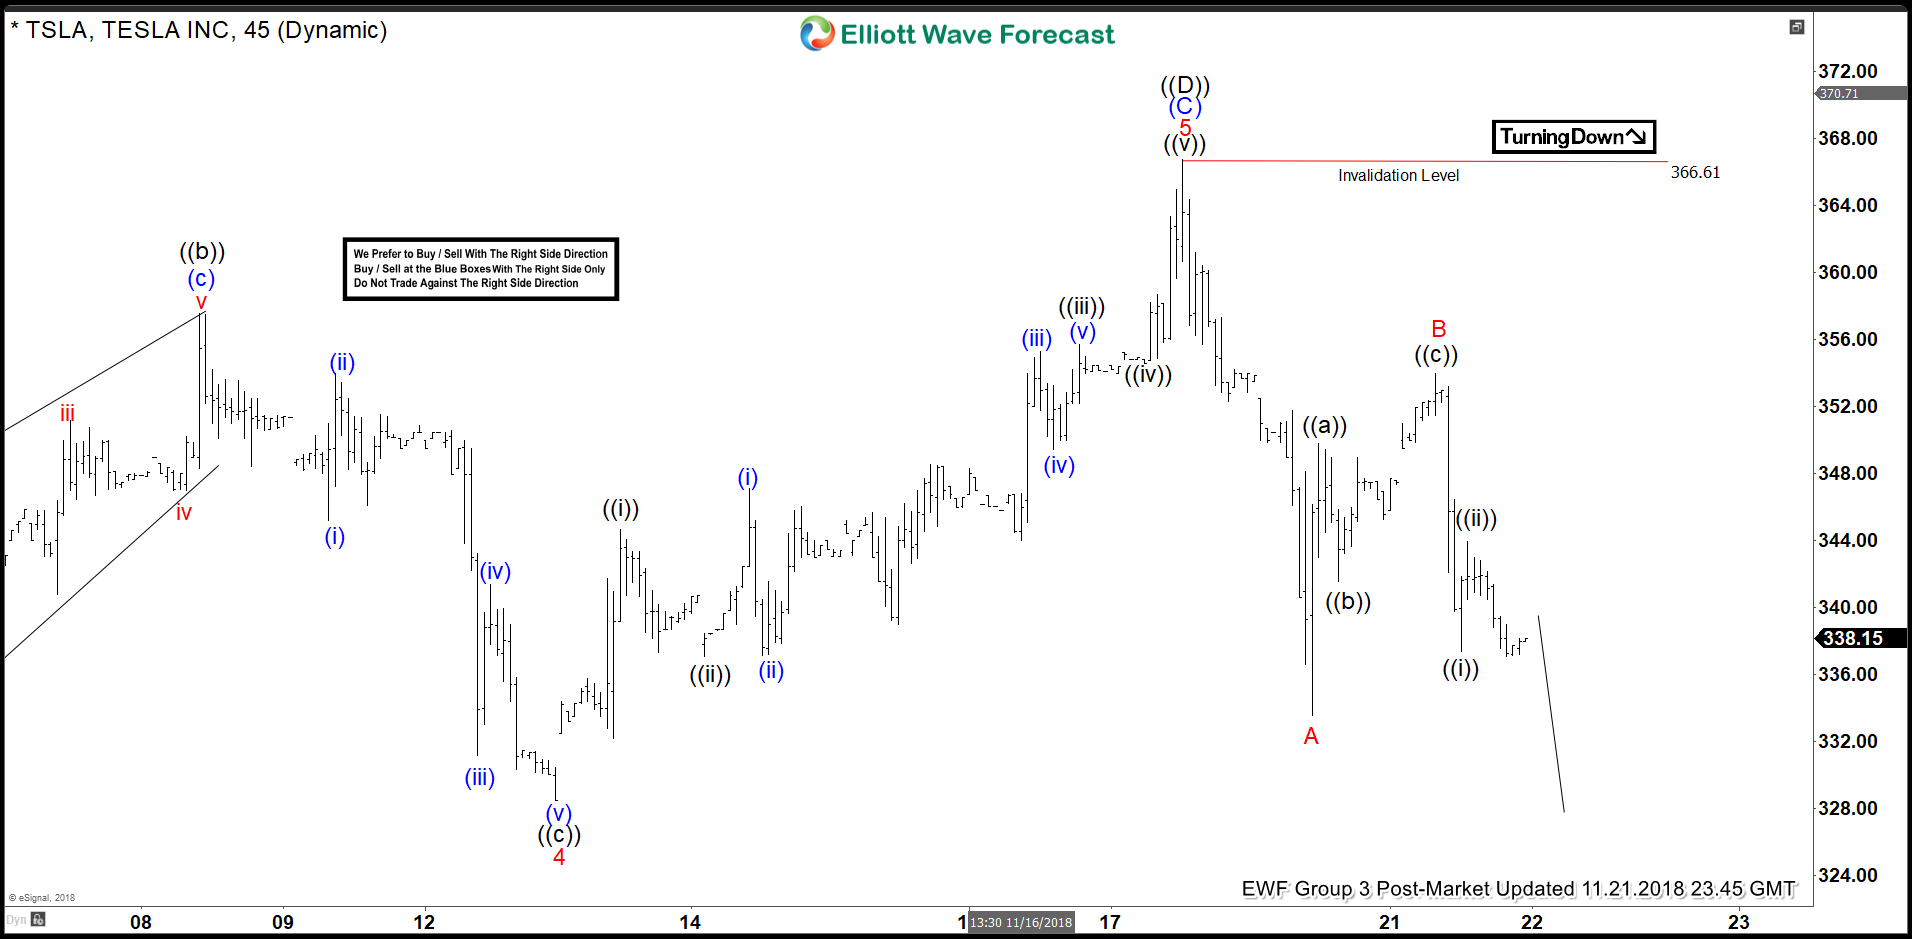
Tesla ticker symbol: $TSLA short-term Elliott wave view suggests that Minor wave 3 ended at $349.20 high. Down from there, a pullback to $328.50 low ended Minor wave 4. The internals of that pullback unfolded as a Flat correction. Minute wave ((a)) of 4 ended at $330.14 low in lesser degree Flat correction. Above from there a bounce to $357.58 high ended Minute wave ((b)) of 4 as zigzag structure. Minute wave ((c)) of 4 ended in lesser degree 5 waves at $328.50 low.
Up from there, a rally to $366.61 high ended Minor wave 5 in lesser degree 5 waves structure. The move higher also completed Intermediate wave (C) of a Flat correction coming from 9/07/2018 low within primary wave ((D)) of a triangle structure. Down from there, primary wave ((E)) of a bullish triangle structure remains in progress in 7 or 11 swings against 10/10/2018 low (247.29) before a thrust higher is seen.
Down from 366.61, Minor wave A ended at 333.55 low and Minor wave B ended at 354 high. Minor wave C remains in progress towards 320.71-300.13 100%-123.6% Fibonacci extension area of Minor A-B to end intermediate wave (W). Afterwards, the stock is expected to bounce in intermediate wave (X) before a final push lower in intermediate wave (Y) of ((E)) is seen & stock breaks higher. We don’t like selling it.
Tesla 1 Hour Elliott Wave Chart


