Gold miners as a group is unpopular since it topped in 2011 together with Gold. One well-known Index which represents major Gold Miners is the GDX. The Index topped in 2011 at $67 and declined a massive 81% before forming a low in 2016 at $12.40. None of the ample liquidity from central bank’s money printing moves to the Gold Miners in the past 10 years. The Index remains depressed at low level while major indices, techs, crypto-currencies, cannabis all propel higher in a parabolic move.
Unsurprisingly, Gold Miners remain to be one of the most hated sectors. Sentiment to the sector is still very low, but is it about to turn? In this article, we will take a look at a couple of charts to see if they are ready to move higher.
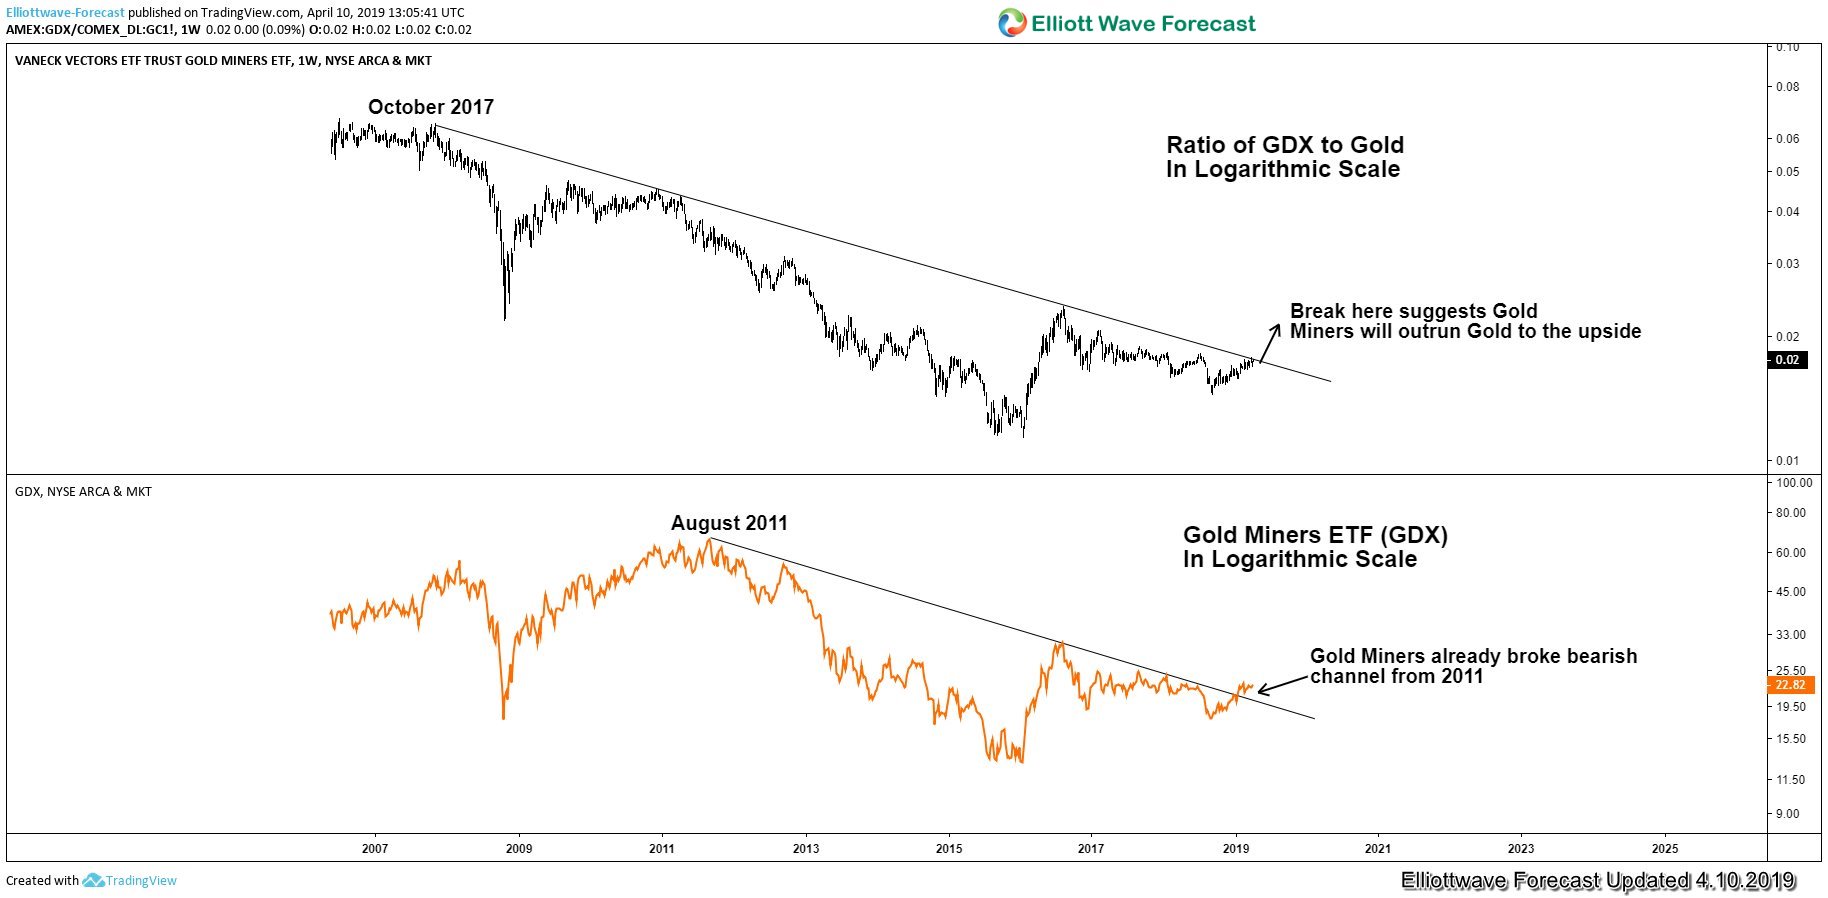
Overlay Chart of GDX-to-Gold Ratio and GDX

The chart above is an overlay chart of GDX-to-Gold ratio and GDX in logarithmic scale. The upper chart is the GDX-to-Gold ratio while the lower chart is the Gold Miners ETF. We can see a couple of things from the above chart:
- A positive correlation between the two charts. They share the same oscillation and move together (up and down) in tandem. This suggests when the ratio is going higher, then Gold Miners is also going higher. The opposite is also true when the ratio goes lower, Gold miners also goes lower.
- GDX-to-Gold ratio (the upper chart) is retesting the bearish trend channel from October 2007 high. A break above this bearish trend line suggests that the Gold Miners Index will outrun Gold to the upside due to rising ratio. A break above the bearish trend line also suggests the Gold Miners should go higher due to the positive correlation.
- The GDX chart (the lower chart) has already broken the bearish trend line from August 2011. This is the same bearish channel in Gold (XAUUSD / GLD) as well after it topped in 2011. This suggests the Gold Miners is ready to recover and rally more.
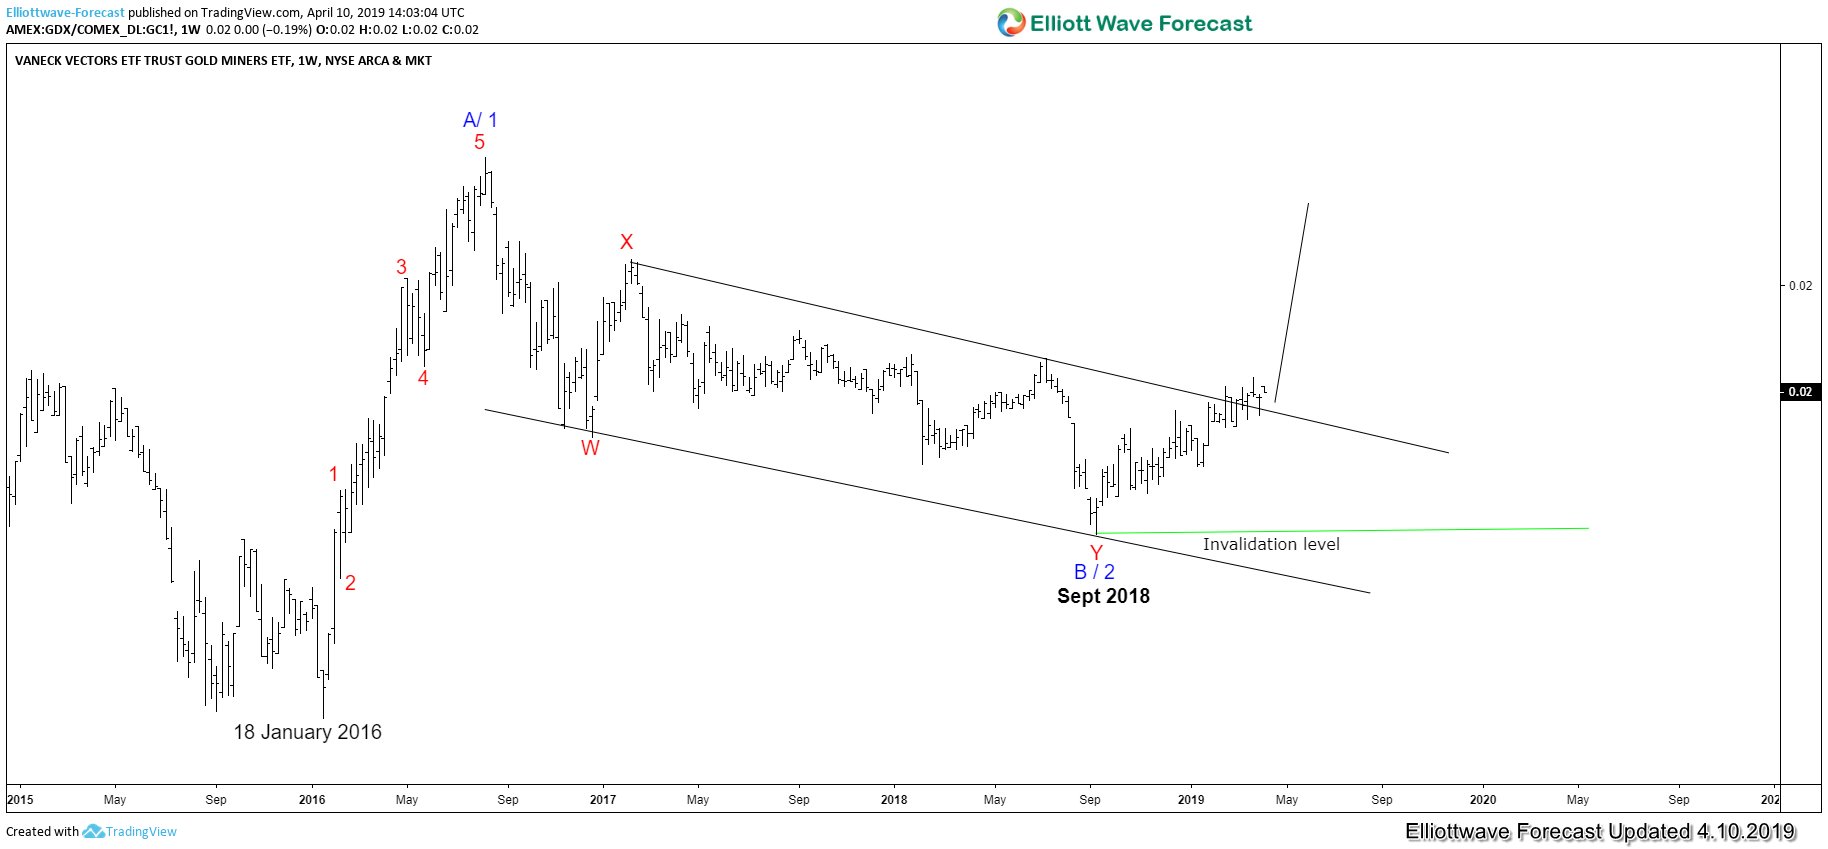
Weekly Elliott Wave Chart of GDX-to-Gold Ratio

From the chart above, we can see that since it formed a low on January 18, 2016, the rally in the GDX-to-Gold looks impulsive and ended wave A / 1 on August 2016. After that, the ratio is in a protracted pullback & possibly ended wave B /2 already on September 2018. The ratio has since broken the descending bearish channel suggesting the next leg higher (wave C / 3) has already started. It still needs the confirmation by breaking above wave A/1 high, but the outlook looks constructive and promising.
We can conclude from the above two charts that Gold Miners could soon make a move to the upside, especially if we can see the GDX-to-Gold ratio breaking above the 2007 trend line.

