GBPJPY Technical Analysis
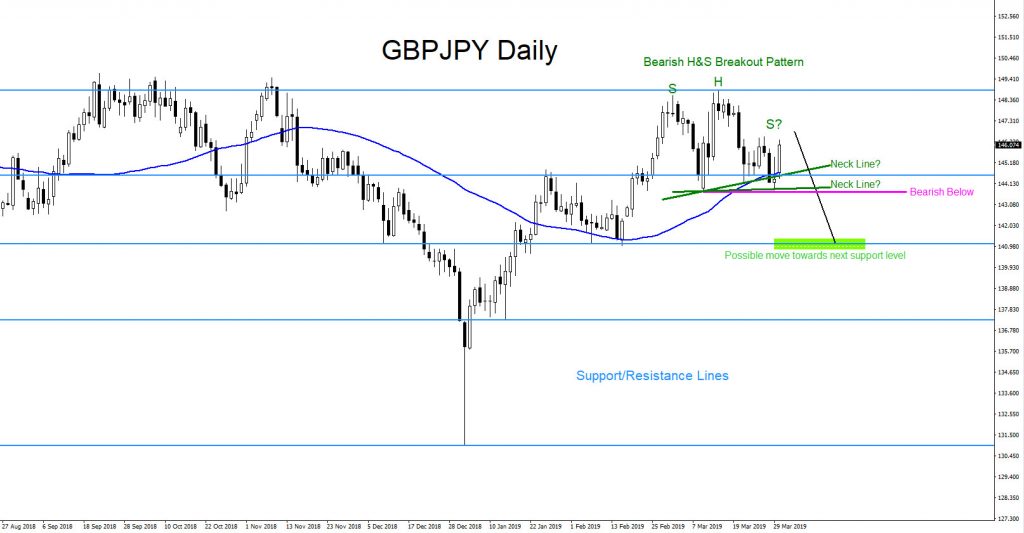
GBPJPY Daily Chart April 1/2019 : On April 1/2019 I posted chart on Twitter of the possibility that the pair could be forming a Bearish Head & Shoulders Breakout Pattern. Traders needed to be patient and wait for the right shoulder to terminate then followed by a break lower below the neck line to confirm the market pattern was valid. This was the first bearish market pattern that was clearly visible at the time which lead us to believe that the pair can possibly break lower to the next support target level in the coming weeks.
GBPJPY Daily Chart 4.1.2019

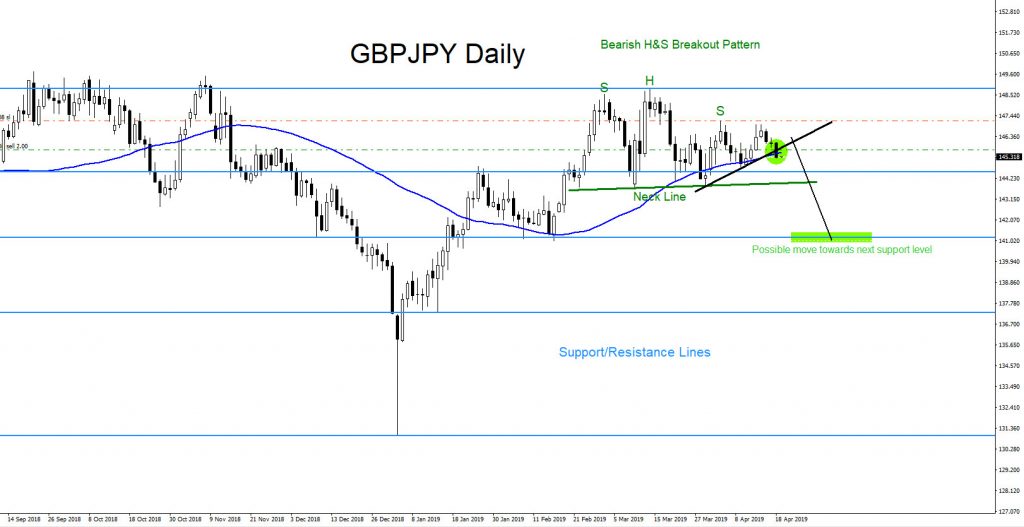
GBPJPY Daily Chart April 18/2019 : On April 18/2019 I posted chart on Twitter showing the right shoulder of the bearish Head & Shoulders pattern could have formed and advised and took the SELL (145.68) on the breakout below the black ascending trend line with stop loss above the top of the right shoulder (147.18).
GBPJPY Daily Chart 4.18.2019

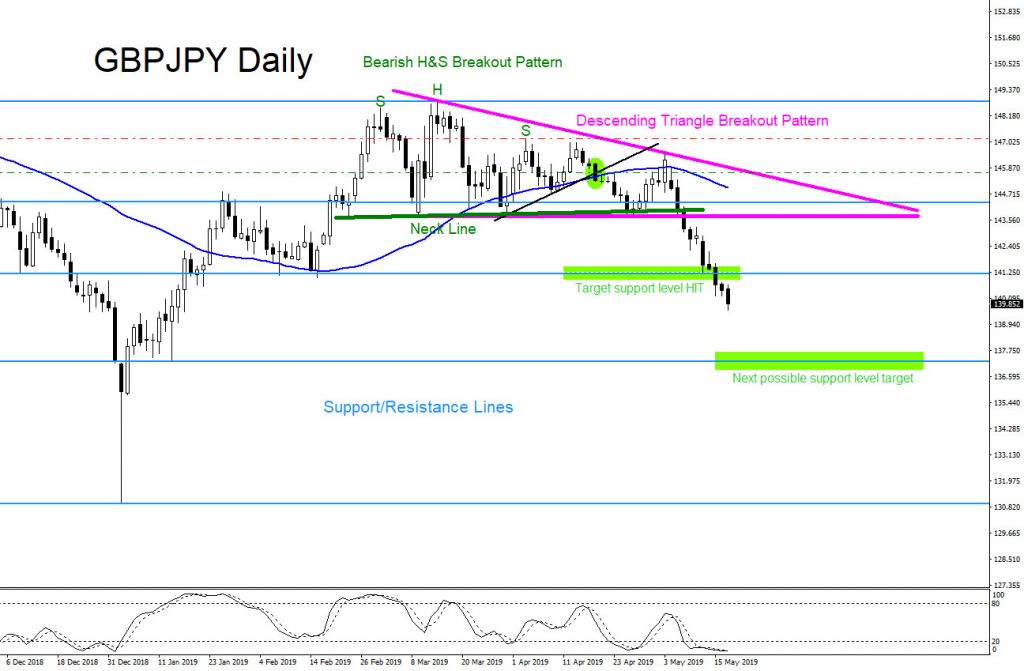
GBPJPY Daily Chart May 18/2019 : The pair has moved lower and HIT the 1st Target Support Level. GBPJPY broke below the neck line of the bearish Head & Shoulders pattern as anticipated and also broke below the Descending Triangle Breakout Pattern which was the 2nd market pattern that formed. The confluence of the triangle breakout level and the H&S neck line breakout level added more traders/bears to enter the market which pushed the pair lower.
GBPJPY Daily Chart 5.18.2019

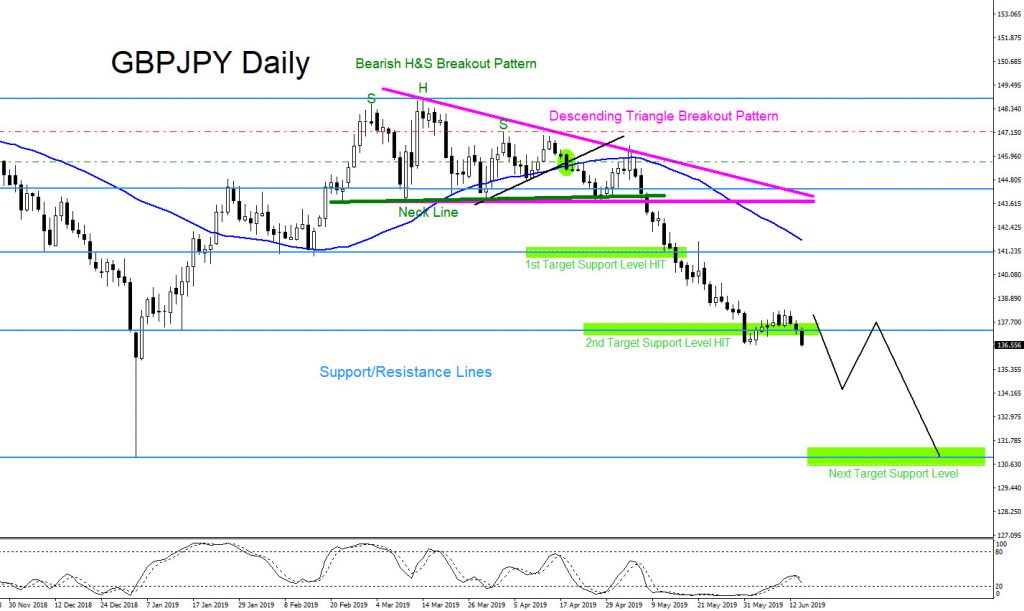
GBPJPY Daily Chart June 16/2019 : The pair has continued lower with a strong bearish momentum and has also HIT the 2nd Target support Level at 137.28 from SELL entry 145.68 which is a +840 pip move. The question now is will GBPJPY continue lower and hit the next Target Support Level ??? Only time will tell what the pair will do but for the meantime I will remain bearish.
GBPJPY Daily Chart 6.16.2019

Of course, like any strategy/technique, there will be times when the strategy/technique fails so proper money/risk management should always be used on every trade. Hope you enjoyed this article.

