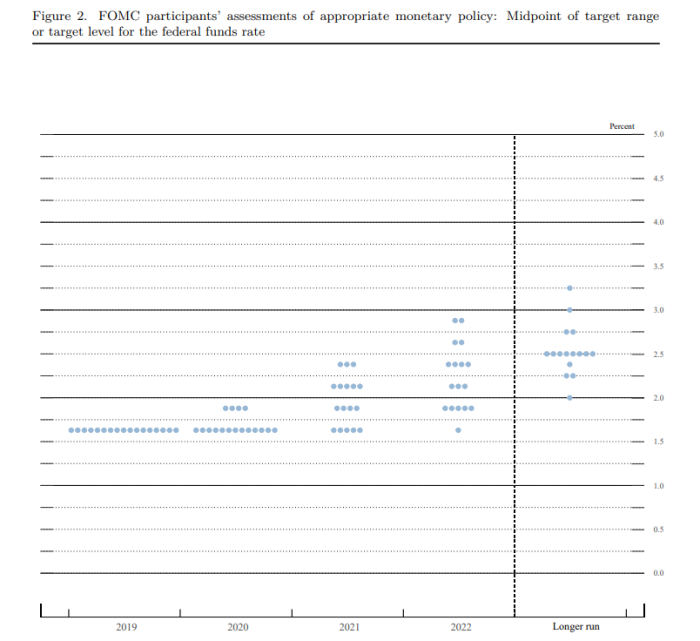
Last week, US Dollar fell across the board after the Fed signaled it will leave policy unchanged for an extended period of time until 2021. The Fed maintained the interest rate unchanged at 1.5 – 1.75%. They also kept the forecast of inflation and GDP unchanged. The central bank’s median rate is forecast to hold steady at 1.6% until the end of 2020, then increase to 1.9% in 2021. The Fed Chairman Jerome Powell said the Fed wants to see a significant and persistent move in inflation before acting on rate. So far, the inflation has remained below the Fed’s target of 2%.
Here’s the December dot plot:
And here’s the September dot plot
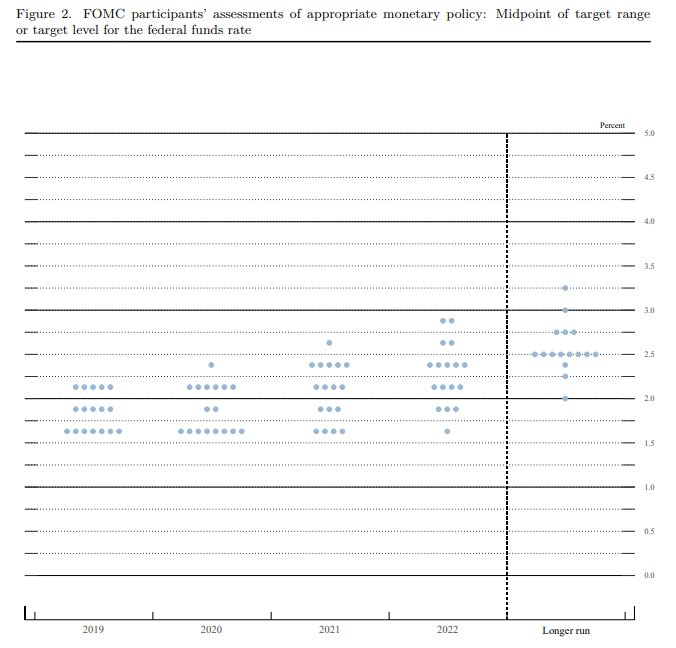
The December’s projection see a downward shift in the dots, with only 4 of 17 members anticipating a quarter rate increase in 2020. The median expectation of fed funds rate at 1.6% in 2020 is down from 1.9% in the September’s estimate. The median rate for 2021 is also down from 2.1% to 1.9%.
USD Index Ended Cycle from February 16, 2018 Low
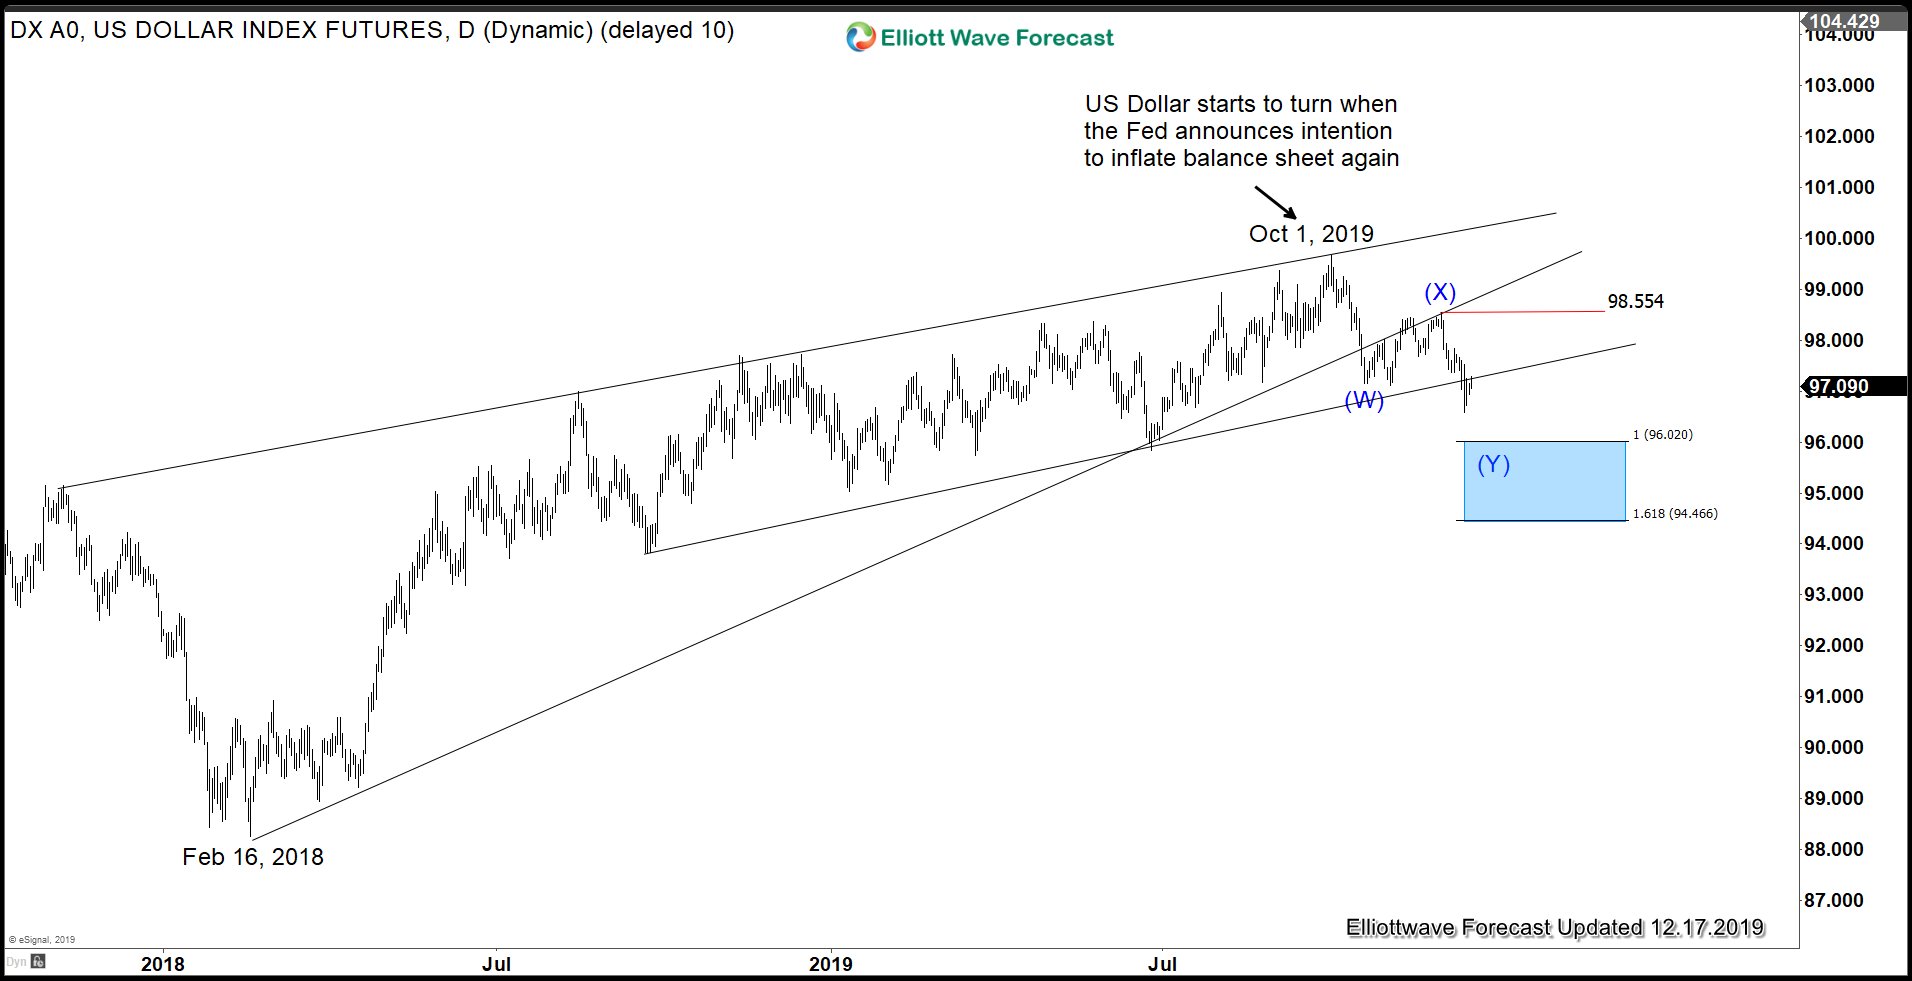
USD Index has broken below the rising trend line from February 16, 2018 low, suggesting it has ended that cycle. At minimum, the Index should now correct that cycle in larger pullback in 3, 7, or 11 swing in the next coming weeks. In the near term, it shows a bearish sequence from October 1, 2019 high. While rally fails below 98.55, expect the Index to extend lower. We don’t like buying the Index and favor further downside.
USD Time Cycle Analysis Indicates Potential Downside
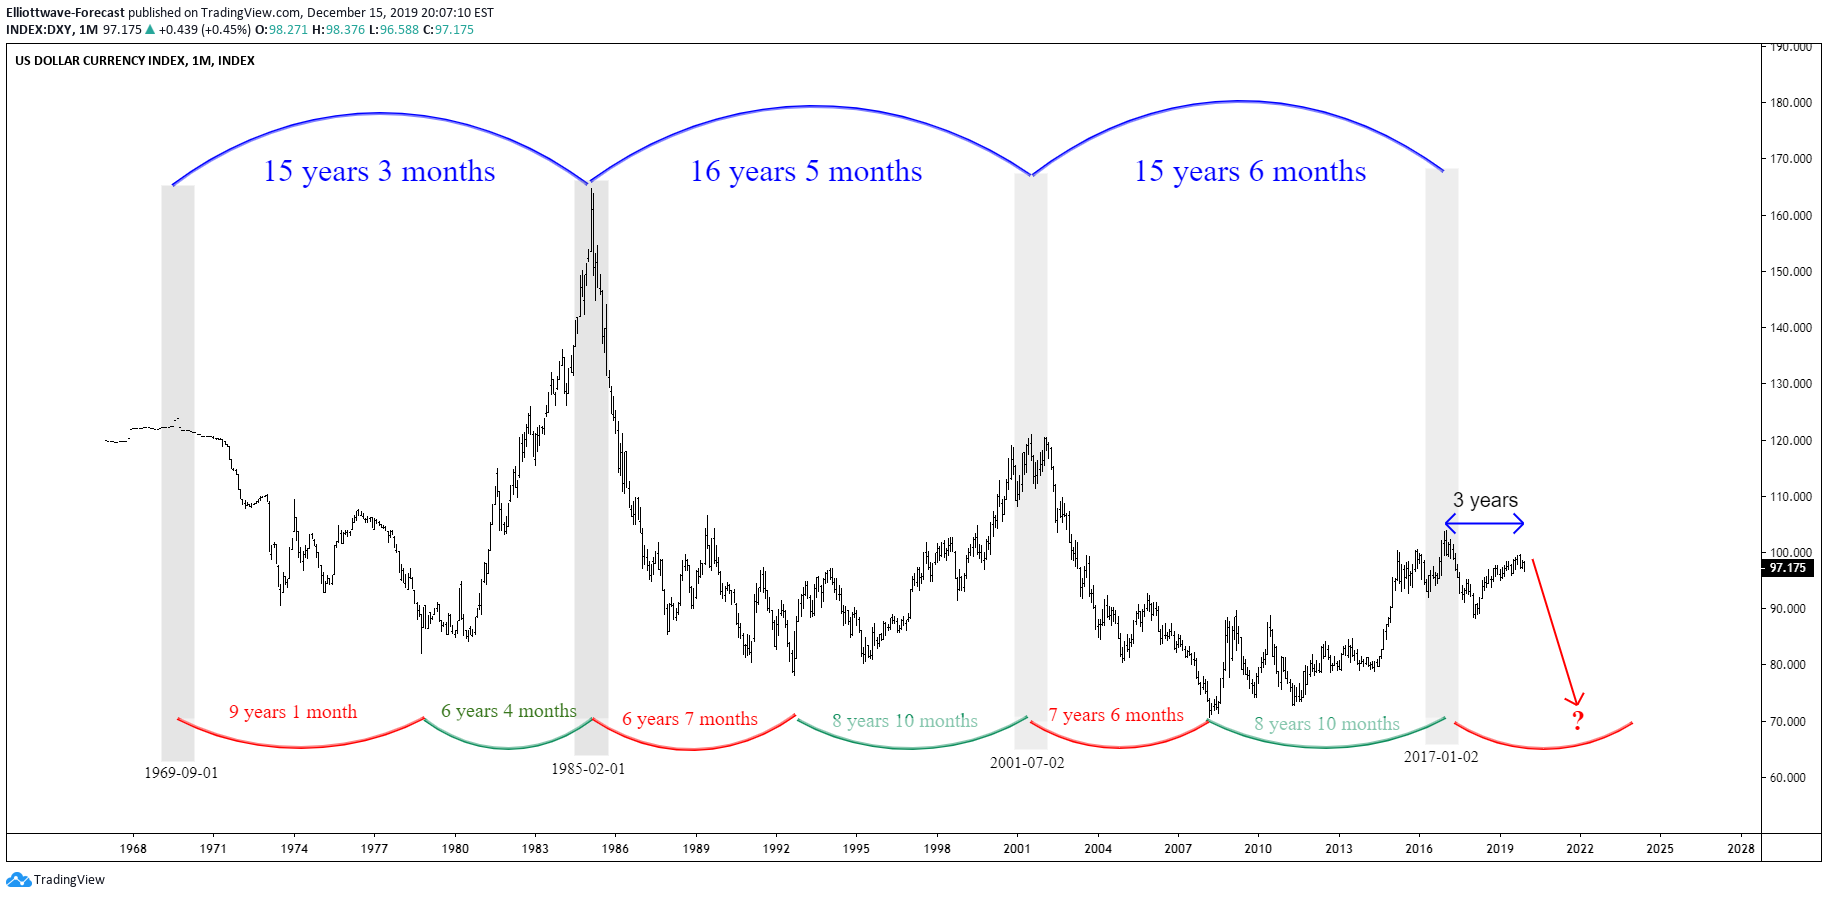
A 15 year cycle in USD Index suggests it may have peaked on January 2017. Previous cycles from 1970 suggests the USD may continue lower in the next 4-5 years.
DXY 1 Hour London 12/17/2019
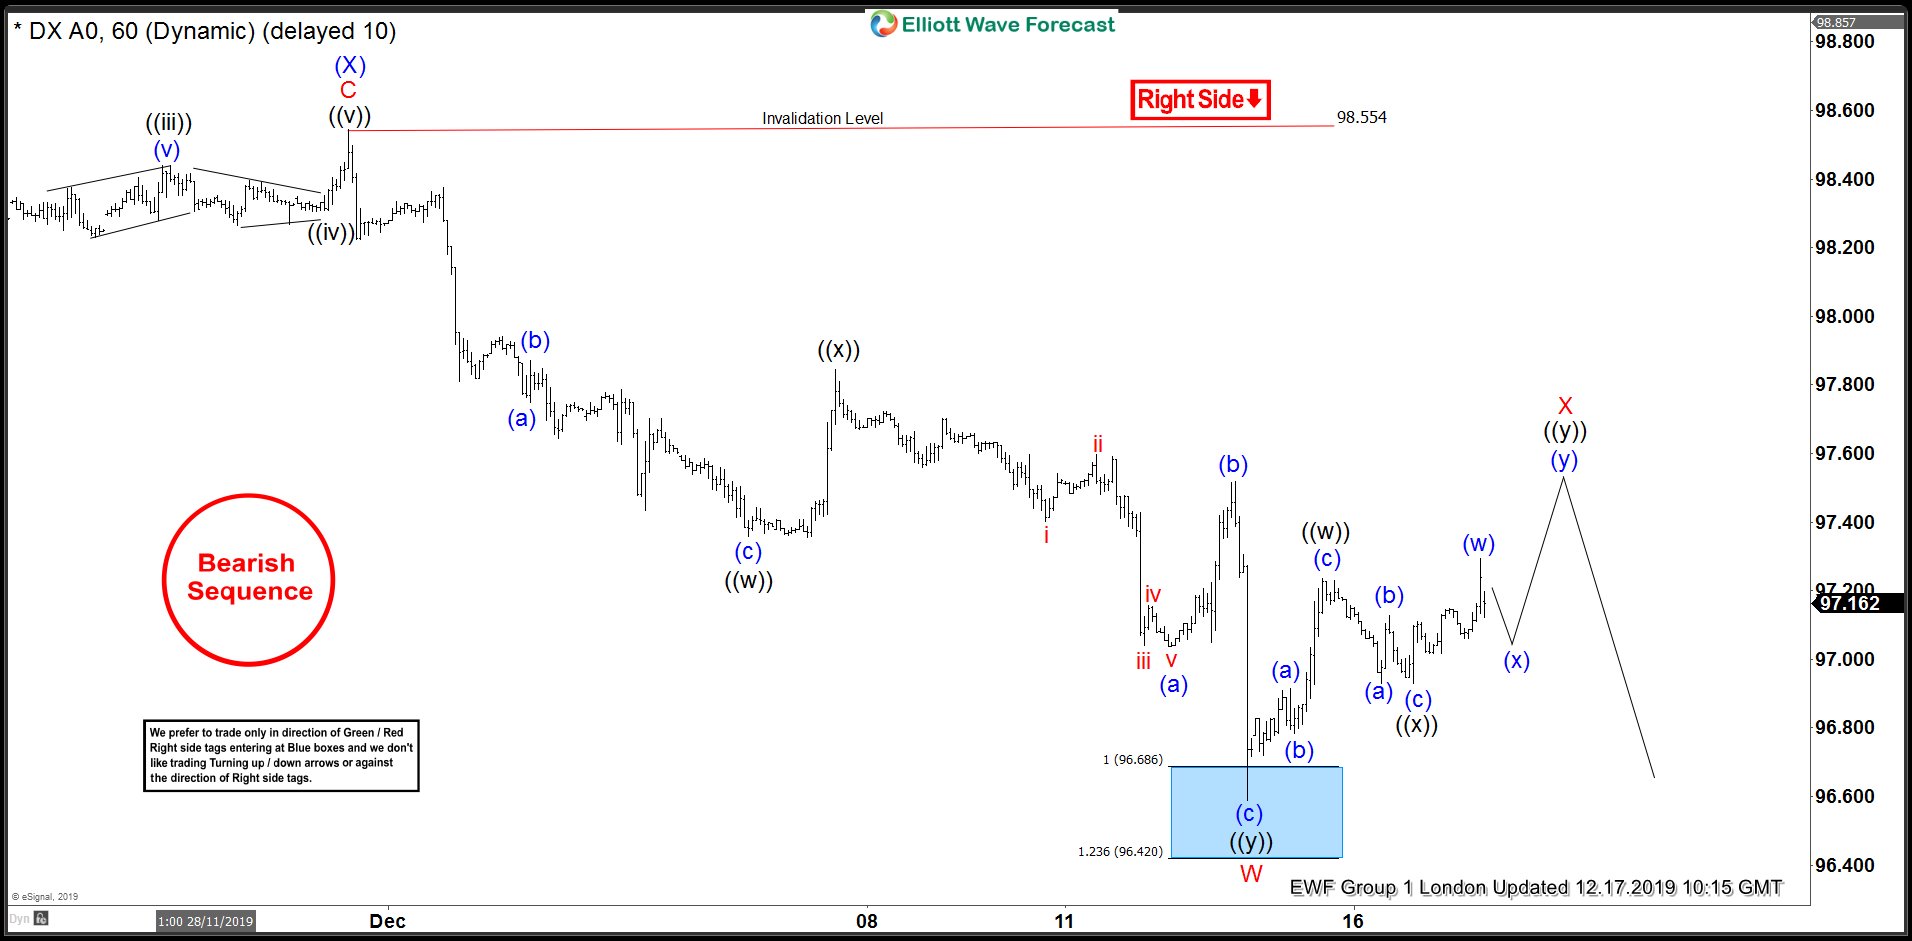
Dollar Index 1 hour chart above shows a bearish sequence with the right side going lower. Near term, any rally is expected to find sellers in the sequence of 3, 7, or 11 swing for further downside. We do not like buying the proposed bounce.

