Chevron Corporation (CVX) is an American multinational energy company. It is the second largest oil company in the United States and has operation in more than 180 countries. Chevron is involved in the entire spectrum of supply chain within the oil and natural gas industries from exploration, production, refining, marketing, transport, and sales. The stock shows a bullish sequence from all-time low but now is in the process of correcting cycle from March 2020 low. Below is the Elliott Wave outlook for the stock.
Chevron Monthly Elliott Wave Chart

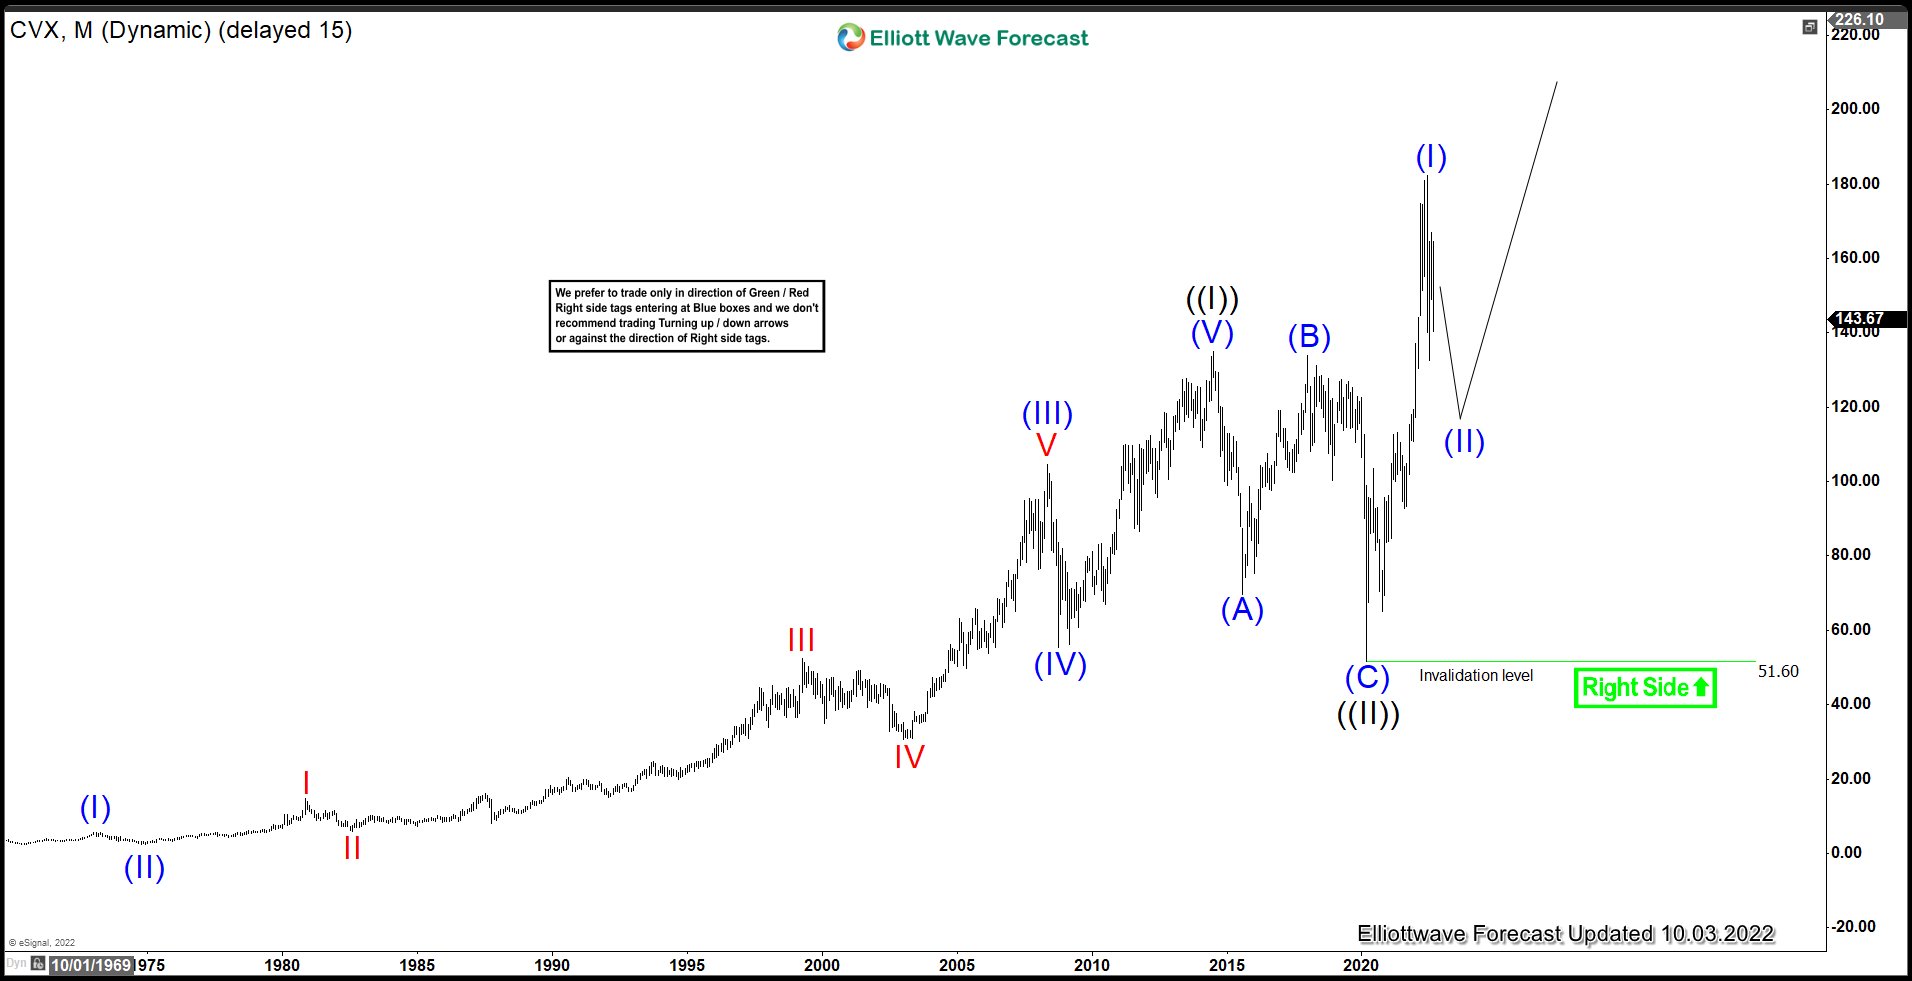
Monthly Elliott Wave of CVX above shows a higher high bullish sequence in the stock. Rally to $135.1 ended wave ((I)). Pullback in wave ((II)) ended at $51.60 with internal subdivision as a zigzag structure. Down from wave ((I)), wave (A) ended at $69.58, rally in wave (B) ended at $133.88, and final leg lower wave (C) ended at $51.60 which completed wave ((II)). The stock has resumed higher in wave ((III)). Up from wave ((II)), wave (I) ended at $182.40. Pullback in wave (II) is in progress to correct cycle from March 2020 low in 3, 7, or 11 swing before the rally resumes. As far as pivot at $51.6 low stays intact, expect dips to find support in 3, 7, or 11 swing for further upside.
Chevron Daily Elliott Wave Chart

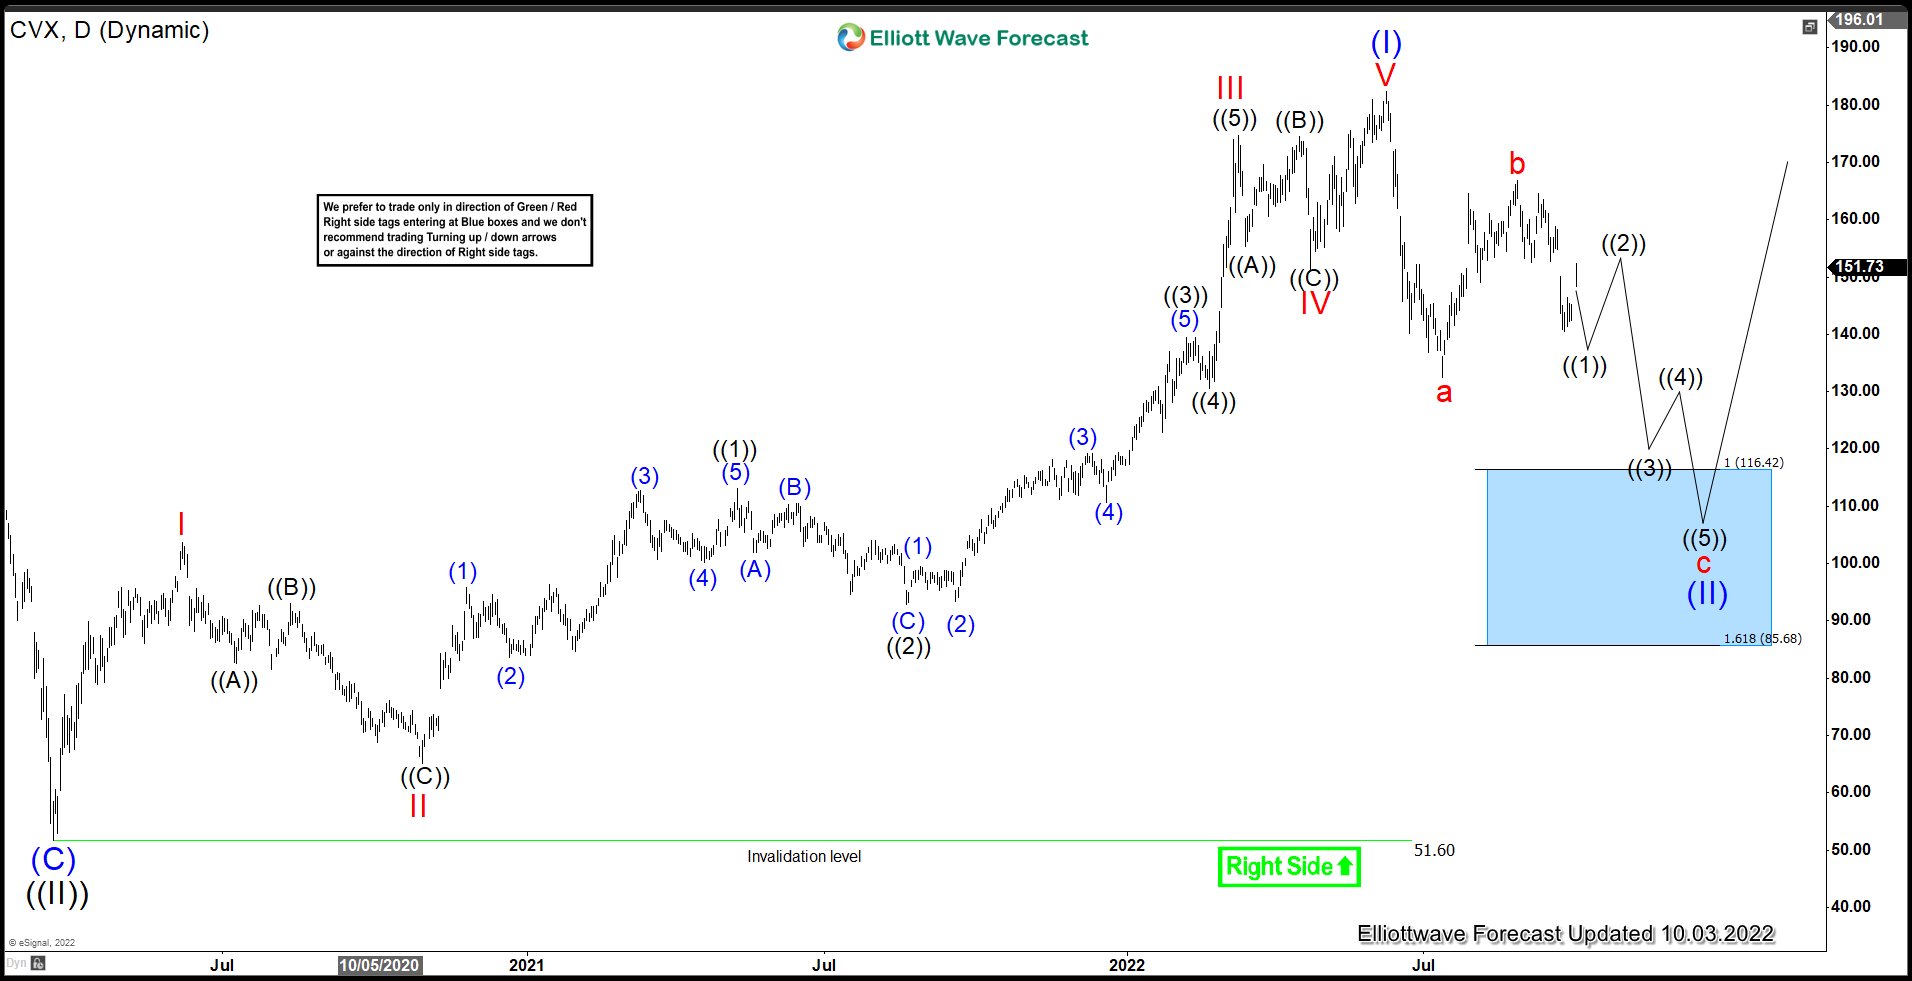
Daily Chart of CVX above suggests that the stock still has scope to extend lower to correct cycle from 3.19.2020 low in larger degree 3 swing towards $87.7 – #116.4 blue box area. From this area, the stock should extend higher to new high or rally in 3 waves at least. As far as pivot at $51.6 low stays intact, expect dips to find support in 3, 7, or 11 swing for further upside.

