Hello Traders! In today’s article, we will look at the past performance of the 1 Hour Elliottwave chart of $GDX. The rally from 3.09.2023 low unfolded as 5 waves which created a bullish sequence in our system. Therefore, we knew that the structure in $GDX is incomplete to the upside & should see more strength in 3, 7 or 11 swings against 3.06.2023 low. So, we advised members to buy the dips in 3, 7, or 11 swings at extremes. We will explain the structure & forecast below:
$GDX 1H Pre-Market Chart 3.16.2023:
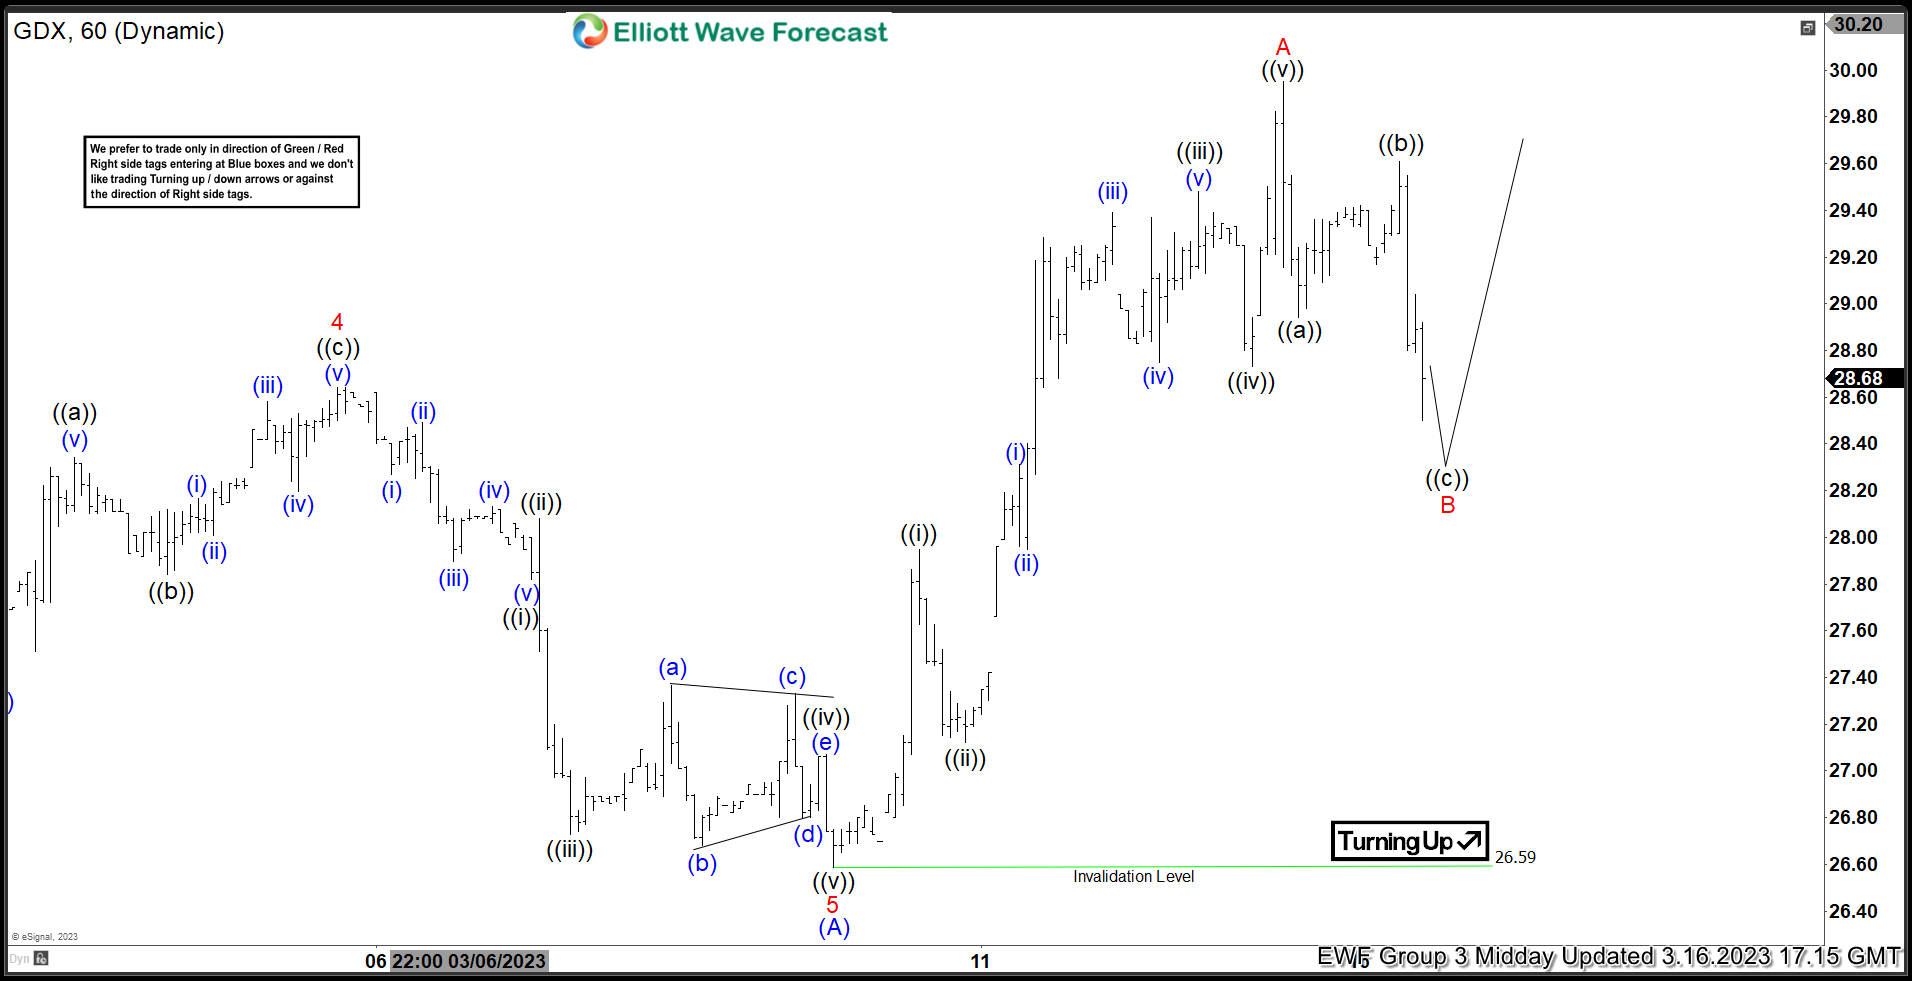
Here is the 1H Elliottwave count from 3.16.2023. We were calling for the decline to find buyers in 3 swings at red B once the connector at ((b)) is in place.
$GDX 1H Midday Chart 3.16.2023:

On the Midday update, the ETF was trading within the area and we gave out the signal live in the chatroom to enter at market price. The trade was journaled in our live trading room.
$GDX 1H Chart 3.17.2023:
Here is the latest 1H chart from 3.17.2023 showing the move taking place as expected. Within the course of 24 hours, The ETF has reacted higher after the 3 swing pullback as expected, breaking above the previous peak at red A. Members are now risk free shortly after taking the position. We like to remain long targeting the equal legs area at $31.80 from where a reaction lower can take place.
Source: https://elliottwave-forecast.com/stock-market/gold-miners-gdx-provide-intraday-setup-last-week/

