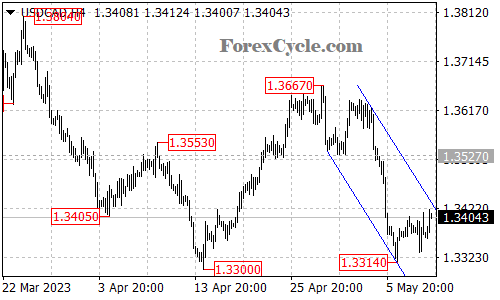
USDCAD is currently facing resistance from the falling price channel on the 4-hour chart. As long as the channel resistance holds, the downtrend from the high of 1.3667 may be expected to resume, and the pair could continue to decline towards the 1.3200 area.
USDCAD failed to break below the key support level of 1.3300 and rebounded from 1.3314. The price is now consolidating between the support of 1.3314 and the resistance of the channel. In the near term, range trading between these levels could be expected.
On the upside, a breakout of the channel resistance would indicate that the downside movement has completed at 1.3314 and that the pair may be ready to reverse its trend. The next target would be at the 1.3500 area, which coincides with the 50% Fibonacci retracement level of the recent downtrend.
However, if the channel resistance holds and the pair fails to break above it, then the downtrend may continue towards the support level of 1.3200. A breakdown below this level could lead to further declines towards the next support level at 1.3000.
In summary, USDCAD is currently facing resistance from the falling price channel on the 4-hour chart, and as long as this resistance holds, the downtrend from 1.3667 could be expected to resume. On the other hand, a breakout above the channel resistance would indicate a reversal of the trend, with the next target at 1.3500. Traders should closely monitor these key levels to determine their trading strategy.


