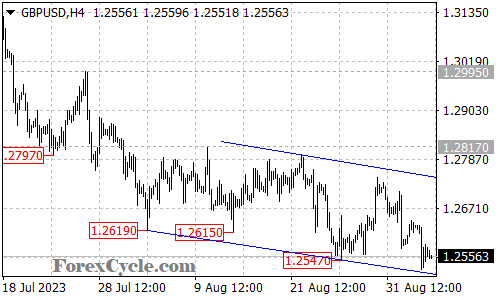
GBP/USD is currently encountering support from the falling price channel on the 4-hour chart.
In the coming days, we might observe range trading between the levels of 1.2515 and 1.2640.
If the 1.2640 resistance level holds, it could suggest a resumption of the downside move, potentially leading to further decline towards 1.2450.
On the other hand, the immediate resistance to keep an eye on is located at 1.2640. A break above this level could bring the price back towards the top of the price channel on the 4-hour chart.
The key resistance level, which holds significance, is situated at 1.2817. Only a break above this level would indicate that the downside movement has completed, potentially setting the next target at the 1.2995 resistance level.

To assess potential trading opportunities, traders should closely monitor the price action in GBP/USD, paying attention to the support of the falling price channel, the resistance at 1.2640, and the key resistance level at 1.2817. These levels will provide valuable information regarding potential continuation or reversal scenarios in GBP/USD.

