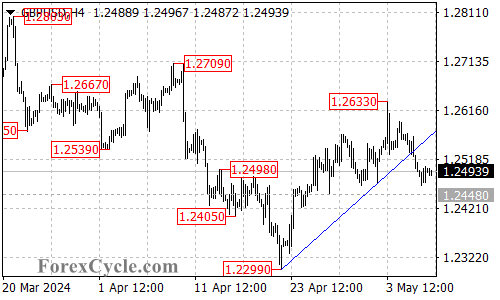
The GBPUSD currency pair has broken below the rising trendline support visible on the 4-hour chart. This technical breakdown suggests that the recent upside move from the 1.2299 low has likely completed at the 1.2633 high.

Deeper Pullback Likely
Following the trendline breakdown, a deeper pullback in the GBPUSD appears likely over the coming days. The first key support to watch on the downside is the 1.2448 level.If sellers can push the pair below 1.2448, it would open the door for a continuation move toward the 1.2400 area. Below 1.2400, the next downside target would be a retest of the 1.2299 previous low.
Resistance Levels to Watch
In the near-term, the first level of resistance to watch is at 1.2520. A breakout above this level could potentially see the GBPUSD pair retrace back toward the 1.2570 resistance zone.If the pair can reclaim the 1.2570 barrier, the next upside target would be the 1.2633 previous high.
Downside Momentum Building
However, for now, the technical bias has shifted to a more bearish outlook following the breakdown below trendline support. The path of least resistance appears to be further losses toward the 1.2448 and 1.2400 support levels.Only a move back above the 1.2520 and 1.2570 resistance levels would ease the downside pressure and shift the bias back to a more neutral stance.
Key Levels to Watch
The key levels to watch in the GBPUSD are the 1.2448 and 1.2400 downside targets, along with the 1.2520, 1.2570, and 1.2633 resistance barriers.
As long as the pair remains below 1.2520, the overall technical bias will remain bearish, with the potential for a retest of the 1.2299 low if the 1.2400 support gives way.
The GBPUSD has shifted to a more bearish technical outlook after the recent breakdown below trendline support. Traders will want to closely monitor the price action around the key support and resistance levels highlighted to determine if the downside momentum will continue to build or if a more significant rebound could unfold.

