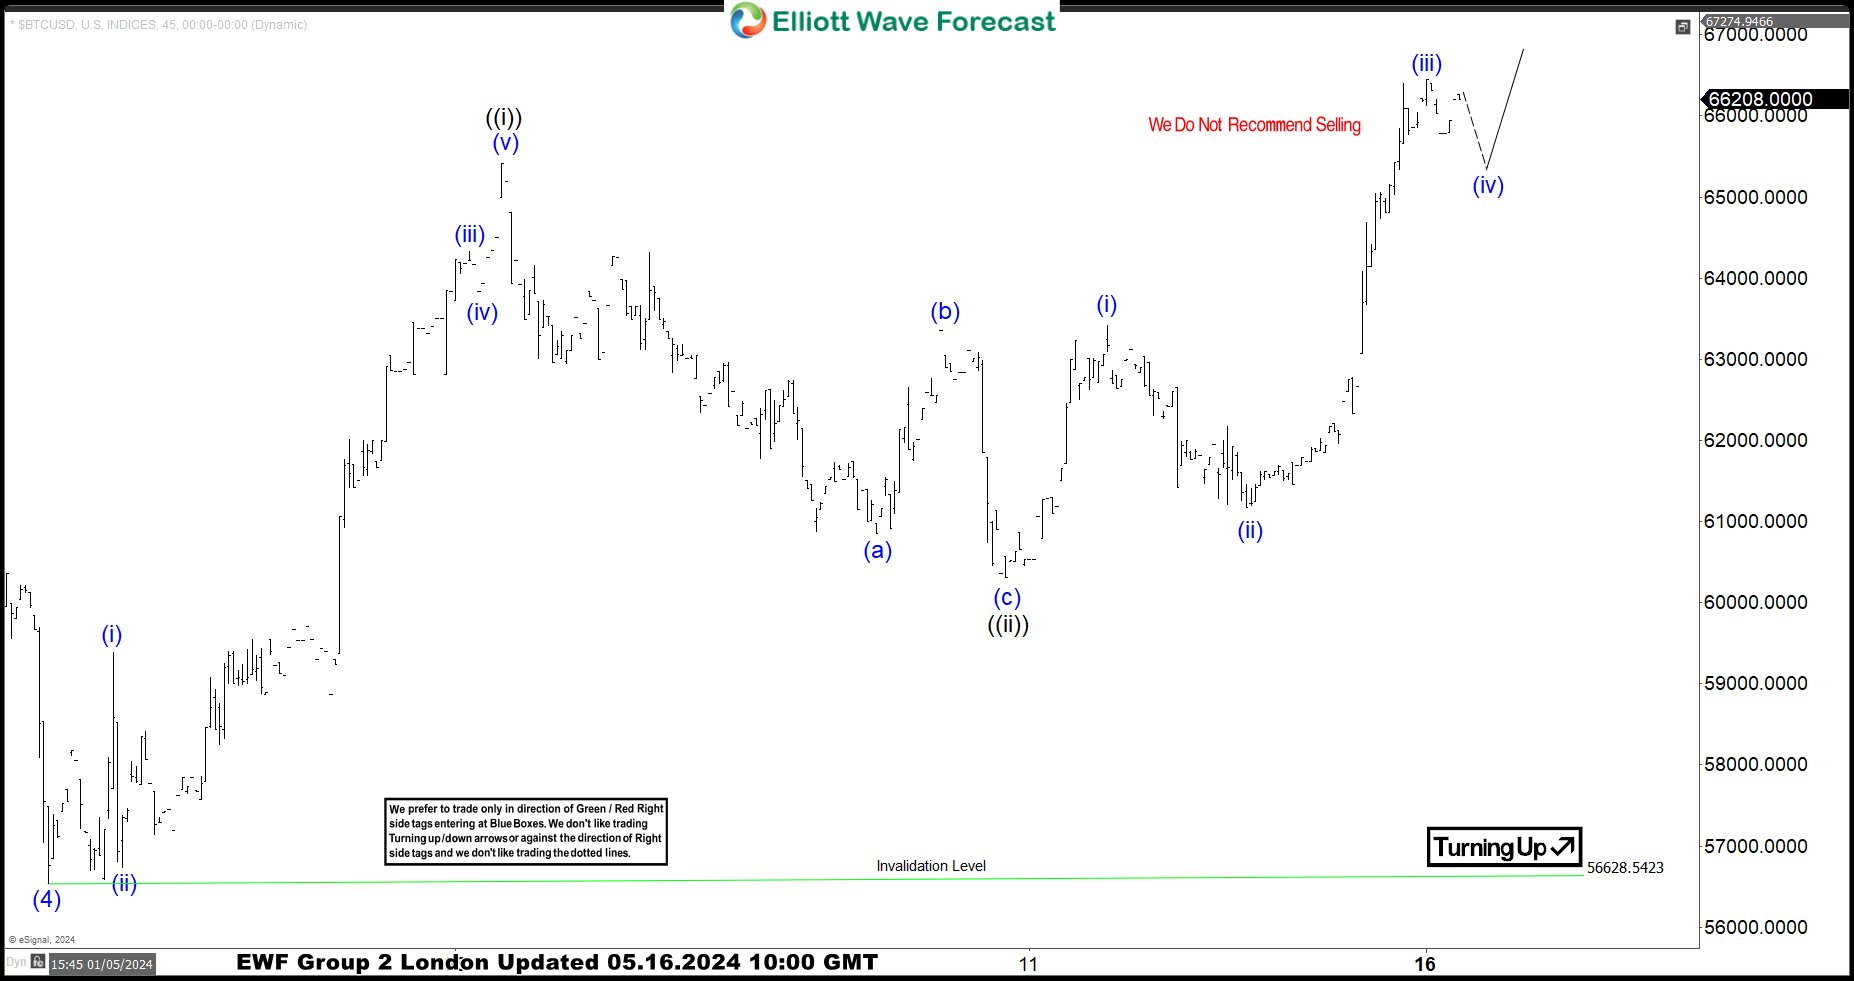
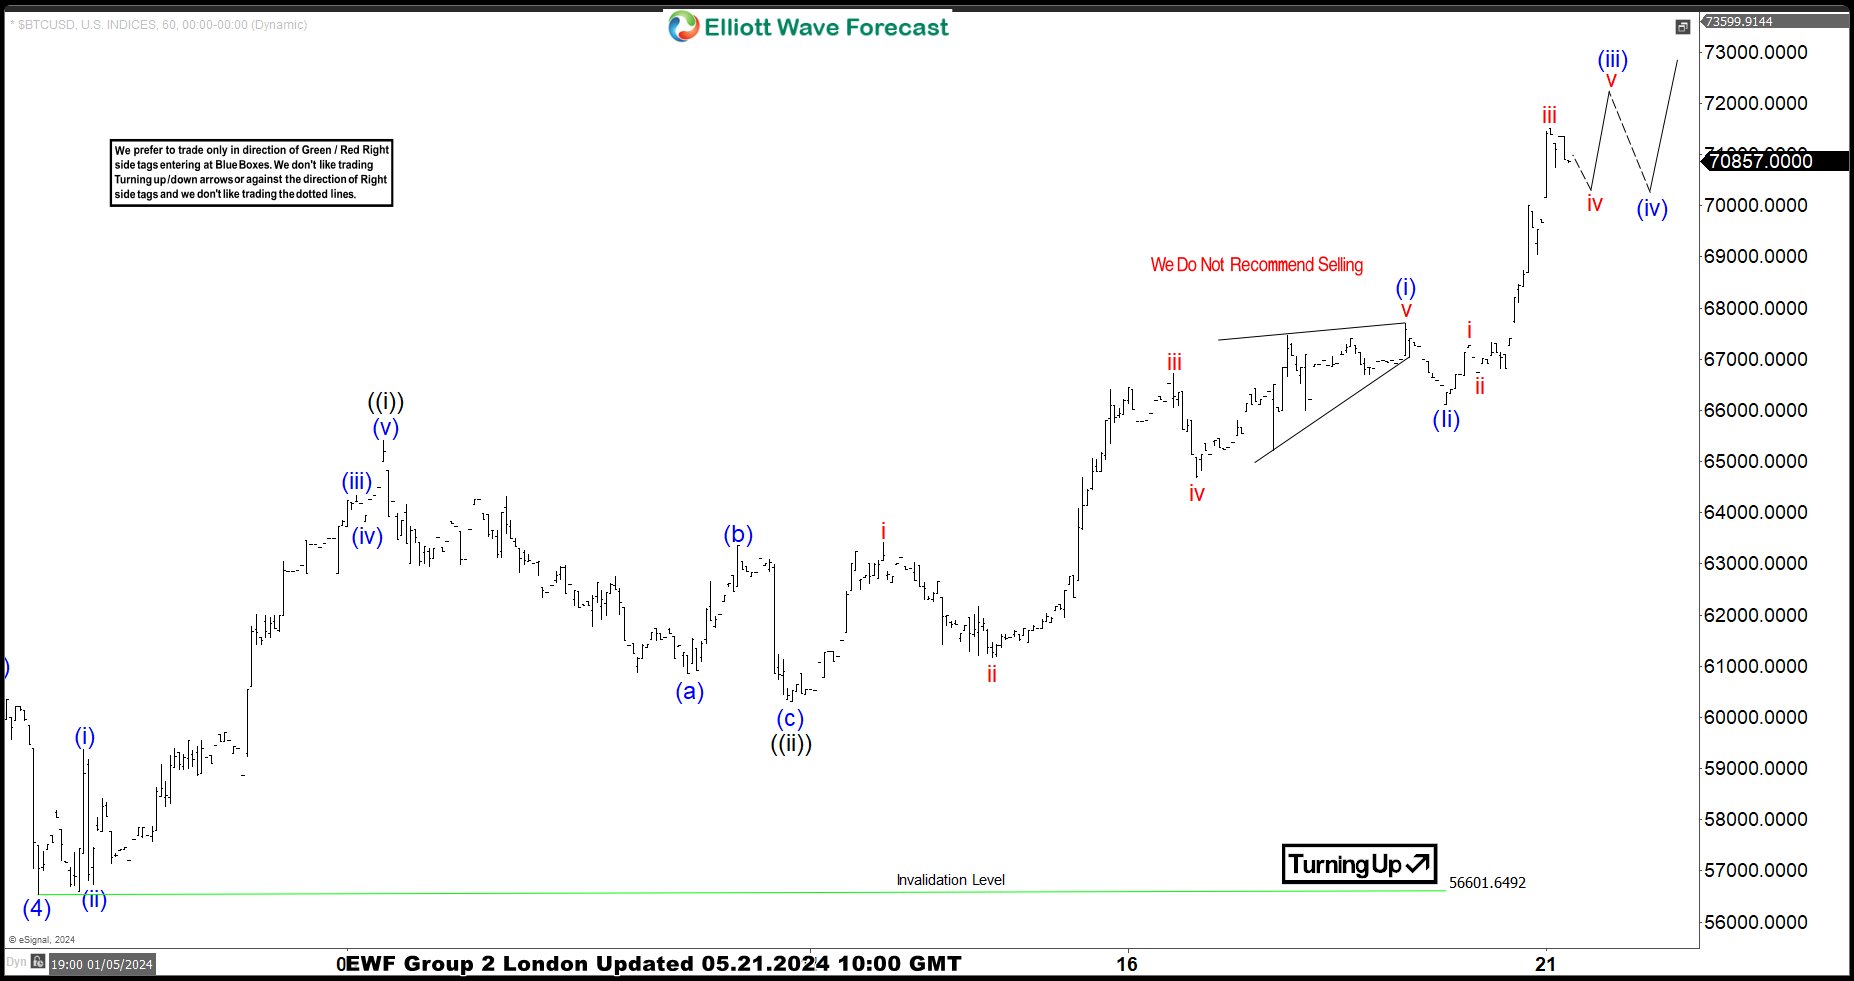
In this technical article we’re going to take a quick look at the Elliott Wave charts of Bitcoin BTCUSD , published in members area of the website. As our members know, Bitcoin is showing impulsive bullish sequences in the cycle from the 25068 low. BTCUSD ended wave (4) correction at the 56628 . Now, the crypto is showing impulsive bullish sequences in the cycle from the May 1st low. Consequently we expected more strength in short term. In further text we are going to explain Wave forecast.
BTCUSD H1 London Update 05.16.2024
BTCUSD has broken above May 6th peak, which makes cycle from the May 1st low incomplete. Now, the crypto is showing higher high sequences, calling for further rally toward 69274-71331 area. We don’t recommend selling and favor the long side against the 60294 pivot. We expect Bitcoin to keep finding intraday buyers in 3,7,11 swings.
Reminder : You can learn more about Elliott Wave Patterns at our Free Elliott Wave Educational Web Page.
BTCUSD H1 London Update 05.21.2024
Bitcoin made further rally as expected. It has reached our first target zone at 69274-71331 , as expected. From there we can see intraday pull back again. We don’t recommend selling BTCUSD in any proposed pull back and favor the long side.
Remember, the market is dynamic, and the presented view may have changed in the meantime. For the most recent charts and target levels, please refer to the membership area of the site. The best instruments to trade are those with incomplete bullish or bearish swing sequences. We put them in Sequence Report and best among them are presented in the Live Trading Room
New to Elliott Wave ? Check out our Free Elliott Wave Educational Web Page and download our Free Elliott Wave Book.
Source: https://elliottwave-forecast.com/cryptos/bitcoin-btcusd-bullish/


