
In this technical article we’re going to take a quick look at the Elliott Wave charts of Dollar Index DXY , published in members area of the website. As our members know, Dollar has given us recovery against the 105.21 peak. It found sellers after 3 waves pattern and made the decline toward new lows as expected. Consequently, we expect more short-term weakness in the near term. In the further text, we are going to explain the wave count.
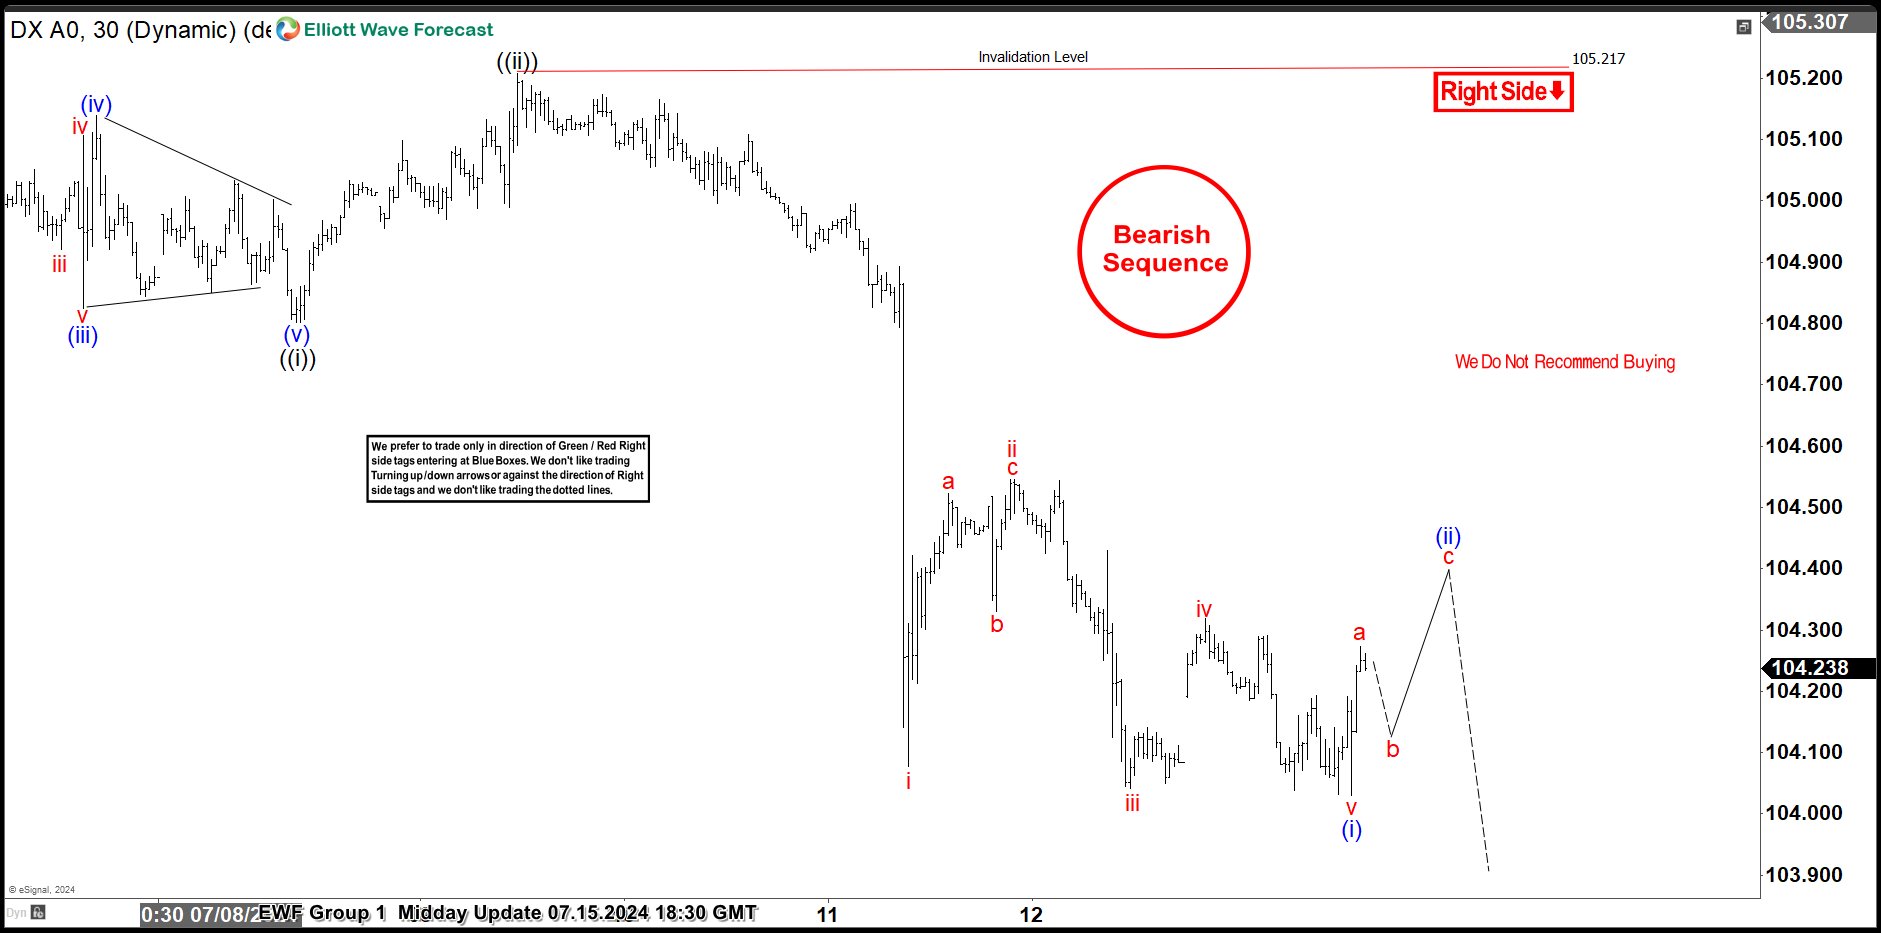
DXY H1 Midday Update 07.15.2024
DXY ended cycle from the 105.217 peak as 5 waves structure leading diagonal. Current view suggests we are getting wave (ii) blue recovery , that can be unfolding as 3 waves bounce. We expect Dollar index to keep finding intraday sellers in 3, 7, and 11 swings.
Reminder : You can learn more about Elliott Wave Patterns at our Free Elliott Wave Educational Web Page.
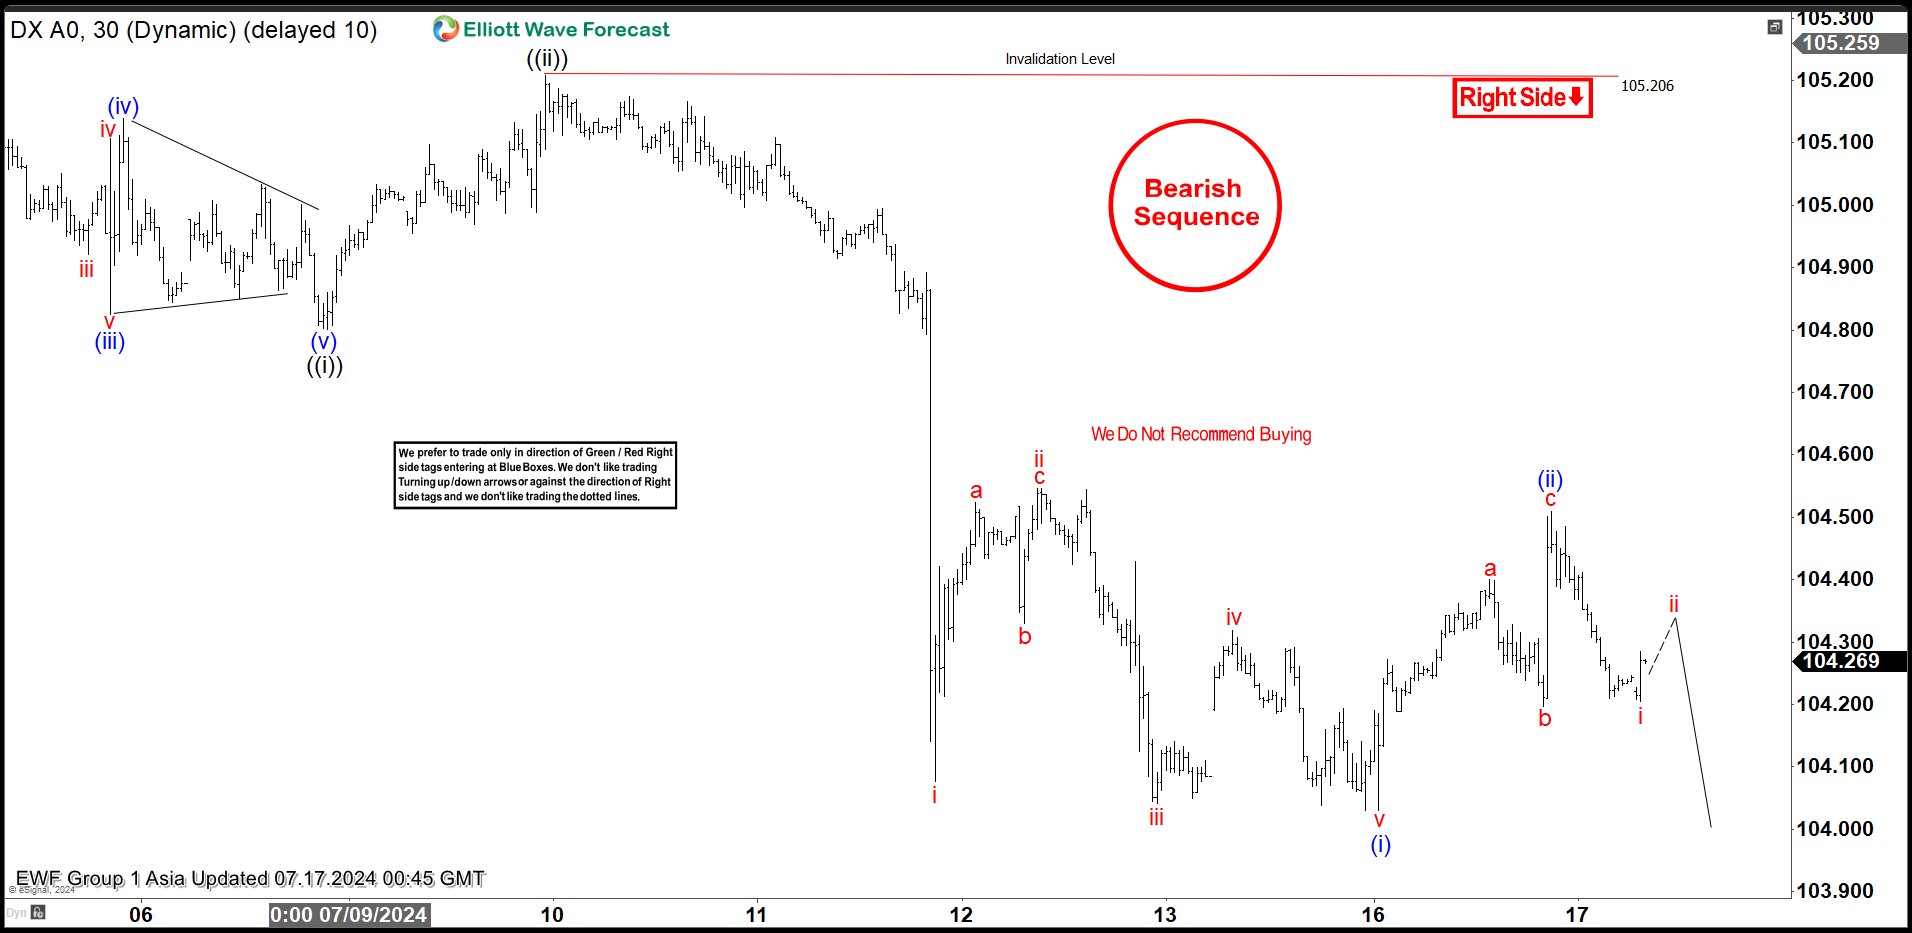
DXY H1 Asia Update 07.17.2024
DXY made clear 3 waves up from the lows. Current view suggests wave (ii) blue recovery is done at 104.50 high, labeled as abc red. As far as the price holds below that level, we expect more downside in near term. We would like to see break below (i) blue to confirm next leg down is in progress.
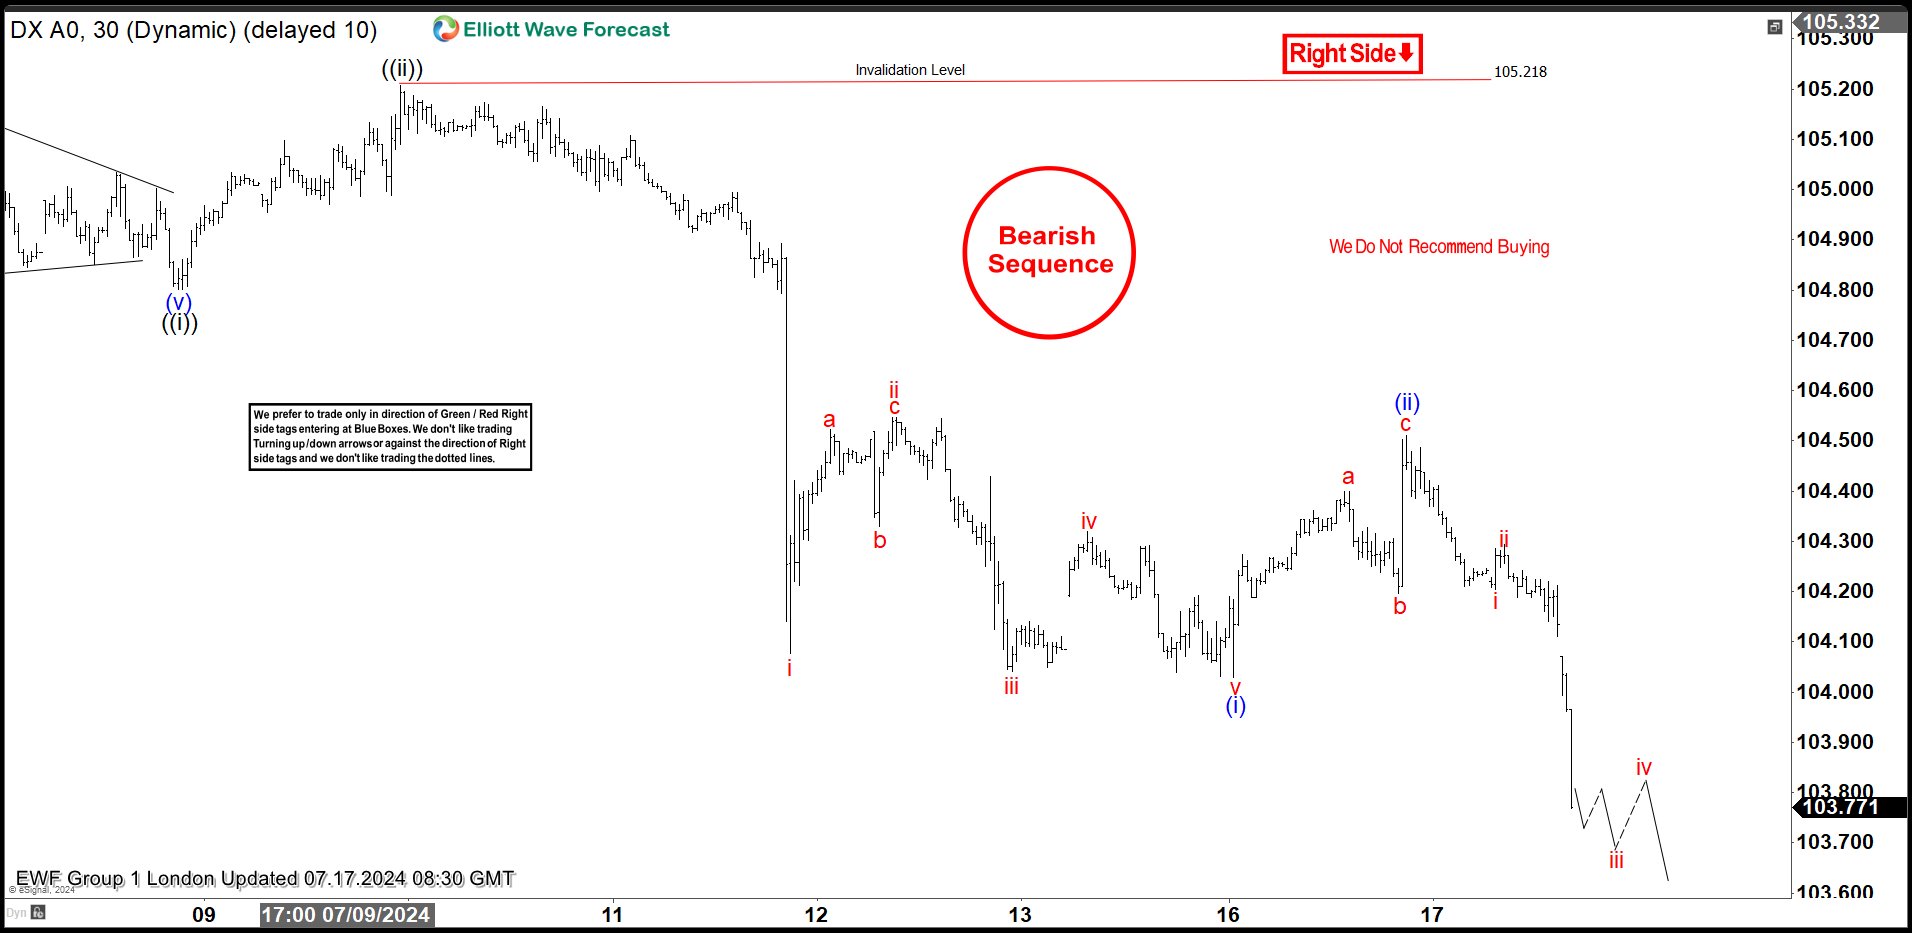
DXY H1 London Update 07.17.2024
Dollar index made a further decline as expected. The price made break of previous low , confirming wave (iii) blue is in progress.
Remember, the market is dynamic, and the presented view may have changed in the meantime. For the most recent charts and target levels, please refer to the membership area of the site. The best instruments to trade are those with incomplete bullish or bearish swing sequences. We put them in Sequence Report and best among them are presented in the Live Trading Room
New to Elliott Wave ? Check out our Free Elliott Wave Educational Web Page and download our Free Elliott Wave Book.
Source: https://elliottwave-forecast.com/forex/dollar-index-dxy-elliott-wave/