Johnson & Johnson (JNJ) is an American multinational corporation founded in 1886 that develops medical devices, pharmaceuticals, and consumer packaged goods. Its common stock is a component of the Dow Jones Industrial Average, and the company is ranked No. 36 on the 2021 Fortune 500 list of the largest United States corporations by total revenue.
JNJ Weekly Chart June 2024
In the last analysis, we had adjusted the labelling of the structure from 186.69 high. Down from the peak. We labeled a flat correction as wave ((W)) where wave (C) was an ending diagonal. Wave (A) ended at 159.17 low in Oct 2022 and wave (B) rally finished at 181.04 high. Then, the structure looked like as a double correction because we had a lot of waves traslaped. However, the momentum slowed down, suggesting that JNJ could be ready for a rally and the ending diagonal structure as wave (C) is the best option for this.
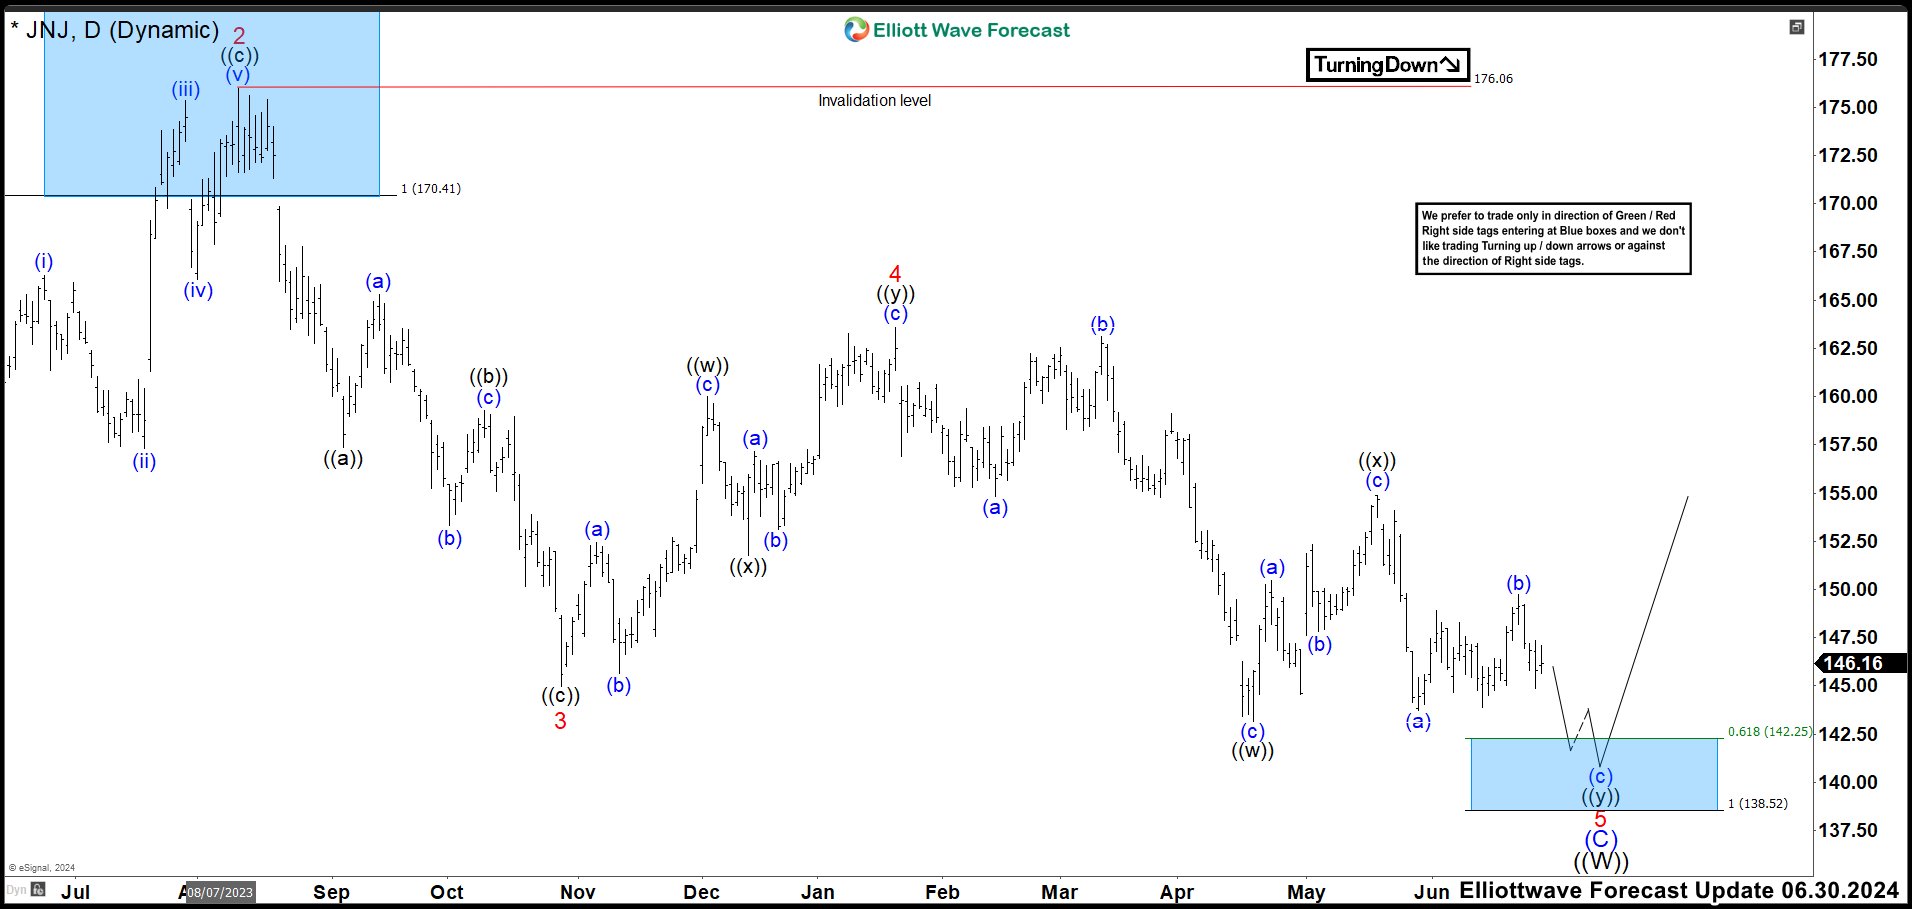
JNJ Daily Chart June 2024

With a new Daily chart of JNJ, the price action broke below 144.95 wave 3 low, suggesting we are currently trading in wave 5 of (C). We said that, it was possible that wave 5 could be ended at 143.13 wave ((w)) low. However, we expected one more slighly low in 142. 25 – 138.52 area to end wave 5 of (C) and ((W)) as a double correction before resuming the rally.
JNJ Weekly Chart October 2024
Above we have last JNJ weekly chart updated. We can see the rally as expected ending wave (A) at 168.85 high and now it is pulling back in wave (B). As minimum we are looking for an (A), (B), (C) structure to complete wave ((X)) before resuming lower in wave ((Y)). However, we cannot rule out for now that JNJ breaks above wave I developing an impulse. If that happens, it is very possible that wave II could be completed.
JNJ Daily Chart October 2024
In the daily chart, we can see how the wave 5 end at 143.13 low developing a flat correction. Missing the slighly low to the bule box area. Wave ((W)) ended and the stock is bouncing in wave ((X)) correction. Wave (A) of ((X)) ended at 168.85 high and wave (B) is building a flat correction lower. The wave (B) could end in 155.87 – 152.82 area and then resume the rally in wave (C) of ((X)). So be it is not clear that JNJ is going to do an impulse or correction from 143.13 low, we prefer to remain bullish and look for buying opportunities.
Source: https://elliottwave-forecast.com/stock-market/jnj-continue-higher-complete-pullback/

