NASDAQ E-Mini Futures (NQ) appears to be extending the bullish sequence from October 2022. Will the sequence finish soon and lead to a big sell-off across the US indices? While the sequence persists, where should traders eye the next opportunity?
The NQ chart is very clear. After the markets recovered from Covid in March/April 2020, a massive bullish cycle followed. This rally continued until November 2021 and was identified as wave (I). From November 2021, a sell-off began to correct the Covid recovery cycle. The sell-off ended in November 2022 and was identified as wave (II). Wave (III) then started in October 2022 and has continued to rise since. The bullish cycle from October 2022 has gained over 105% from its low and lasted nearly 28 months. Further analysis shows this rally as wave I of (III). Therefore, wave (III) still has a long way to go.
When such a bullish sequence emerges, we prefer buying pullbacks in 3, 7, or 11 swings from the blue box. These blue boxes are shown on the chart for Elliottwave-Forecast members. Within the bullish sequence from October 2022, there have been multiple pullbacks. Members have profited from these. The most recent pullback occurred on August 5, 2024. As shown on the 8.4.2024 chart below, we bought at the extreme of this pullback.
Price reached the blue box to conclude a 7-swing structure and then rallied from there. The 8.27.2024 chart below shows a later update we shared with members as we continue to provide update from this extreme area.
From the blue box, NQ gained about 29% until the recent pullback from December 2024 started. Again, pullbacks within a bullish sequence should be a perfect opportunity for buyers to go again. What are the likely scenarios buyers should look forward to, for the next perfect blue box opportunity? This post will provide two best buying scenarios for traders.
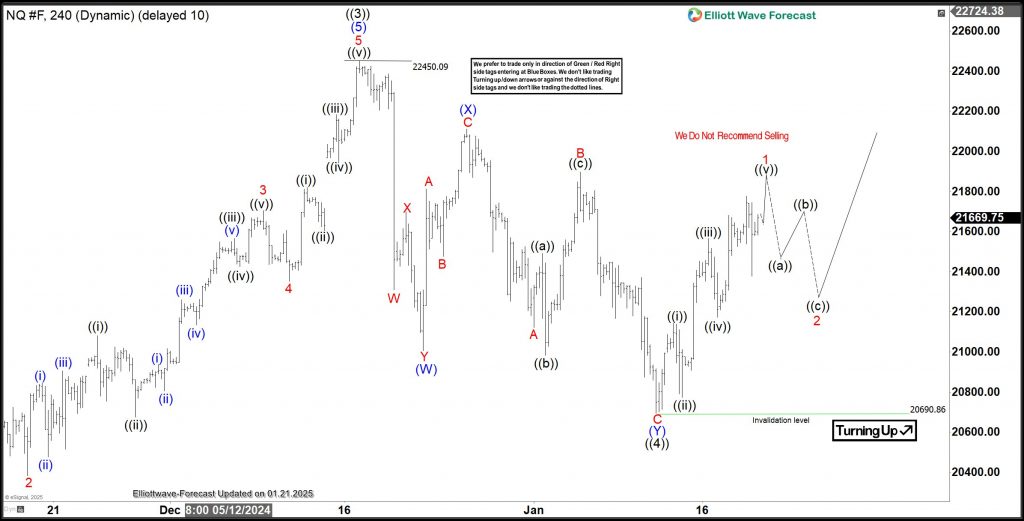
NQ Elliott Wave Analysis – 1st Scenario. 01.21.2025 Update
The NQ chart above shows that wave ((4)) of I ended on January 13, 2025, at 20,690. From this pullback low, wave ((5)) began to emerge. The price is now close to completing wave 1 of (1) of ((5)). A pullback for wave 2 should follow. The best entry was at the extreme of wave ((4)), but it was barely missed. The next opportunity will come after the price breaks above the December 2024 peak at 22,450 with wave 3. After this, buyers can wait for the next pullback. It could be for wave 4, wave ((ii)) of 3, or wave ((iv)) of 3 within the bullish sequence from January 13, 2025. This bullish setup depends on the price breaching the December 2024 high. But what if the price turns lower instead of breaking this high?
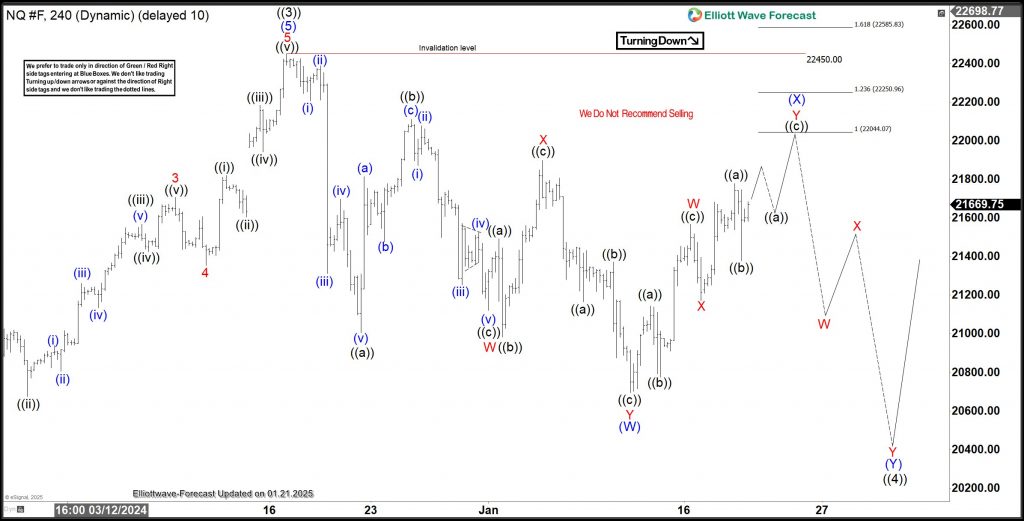
NQ Elliott Wave Analysis – 2nd Scenario. 01.21.2025 Update
If the price doesn’t breach 22,450 to confirm the first scenario, it could fall further for a deeper wave ((4)). As the chart above shows, wave ((4)) could develop into a larger 7-swing structure. Wave (W) ended on January 13, 2025, where the current bounce for wave (X) began. Wave (X) may extend to 22,044.07–22,250.96. If the price turns lower from this zone or below it, buyers can watch for the next extreme of wave ((4)) for a perfect long entry. However, if the bounce breaches 22,450, this scenario becomes invalid, and the first scenario becomes valid. In either case, we have prepared our members to act. The strategy is simple: just buy from the blue box!
Source: https://elliottwave-forecast.com/stock-market/nasdaq-nq-elliott-wave-two-scenarios/


