
In this technical blog, we will look at the past performance of the 1-hour Elliott Wave Charts of SPX. We presented to members at the elliottwave-forecast. In which, the rally from 13 January 2025 unfolded as an impulse structure. And showed a higher high sequence favored more upside extension to take place. Therefore, we advised members not to sell the index & buy the pullback in 3, 7, or 11 swings. Based on Elliott wave hedging area looking to get 3 wave reaction higher at least. We will explain the structure & forecast below:
SPX 1-Hour Elliott Wave Chart From 2.01.2025
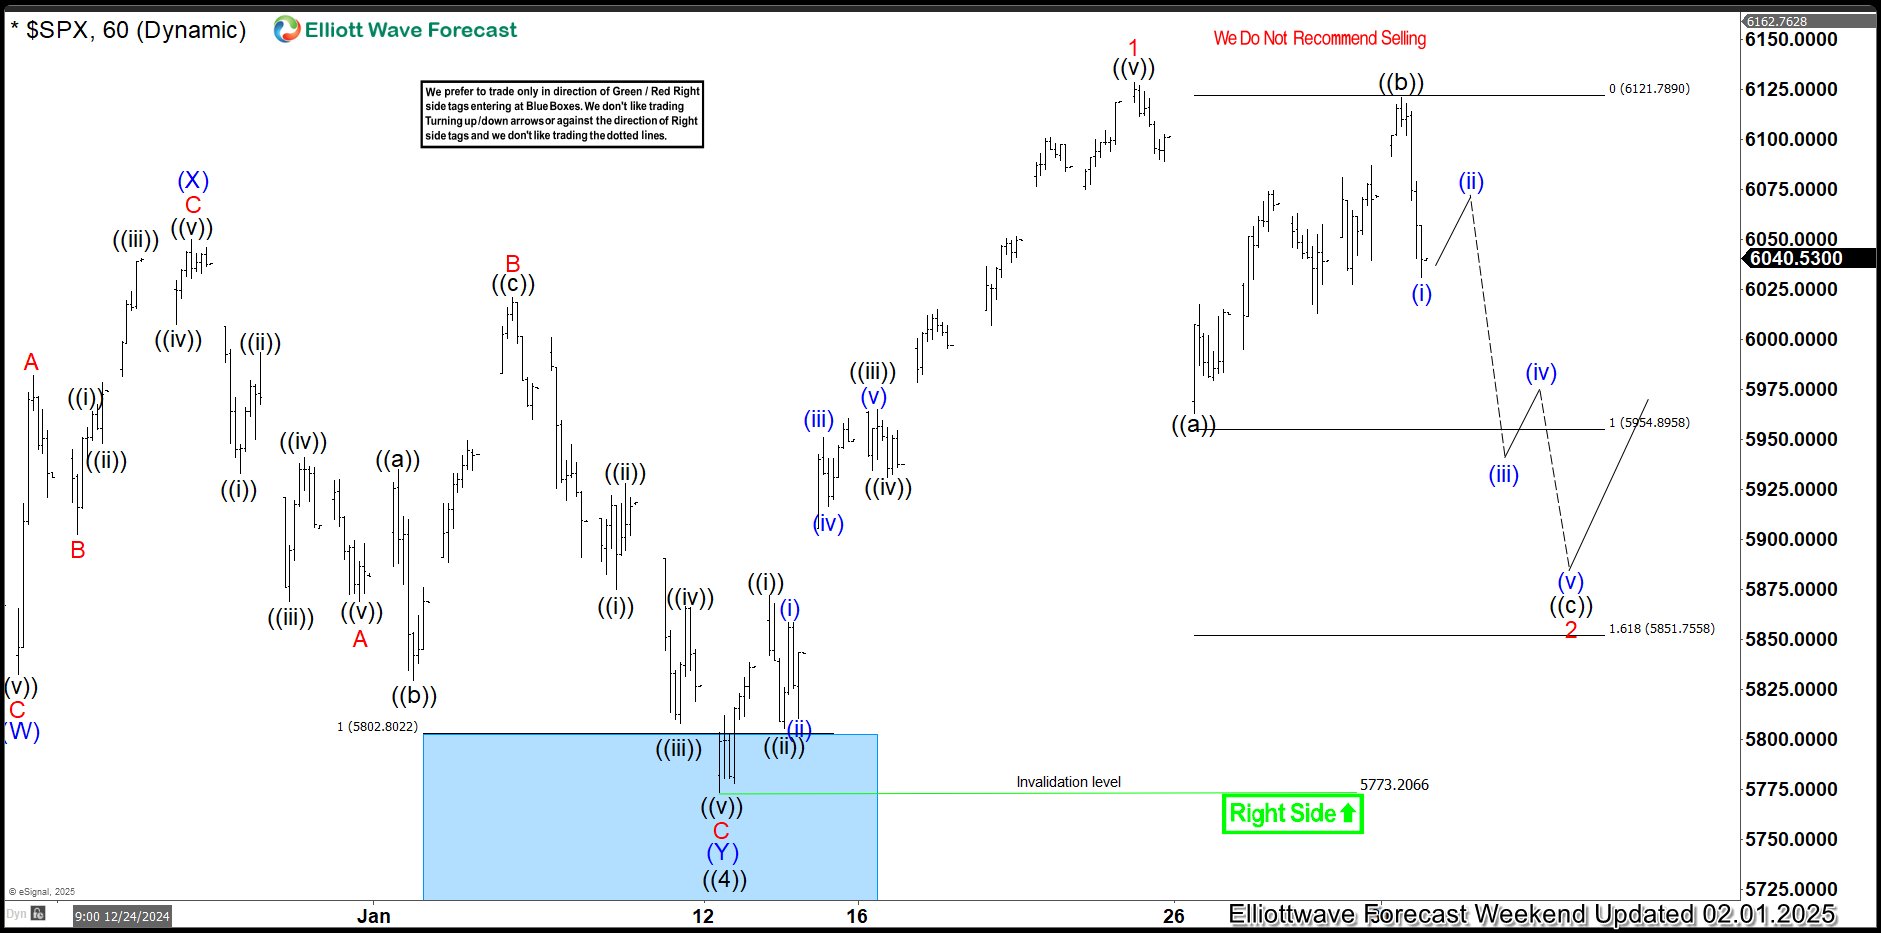
Here’s the 1-hour Elliott wave chart from the 2.01.2025 update. In which, the cycle from the 13 January low ended in wave 1 as an impulse structure at $6128.18 high. Down from there, the index made a pullback in wave 2 to correct that cycle. The internals of that pullback unfolded as Elliott wave zigzag structure where wave ((a)) ended at $5962.92 high. Then wave ((b)) bounce ended at $6120.91 high and wave ((c)) was expected to reach the Elliott wave hedging area at $5954.89- $5851.75 area. From there, buyers were expected to appear looking for next extension higher or do a 3 wave reaction higher at least.
SPX Latest 1-Hour Elliott Wave Chart From 2.11.2025

This is the latest 1-hour Elliott wave Chart from 2.11.2025 Asia update. In which the SPX is showing a strong reaction higher taking place, right after ending the zigzag correction within the equal legs area. Allowed members to create a risk-free position shortly after taking the long position. However, a break above $6128.18 high is needed to confirm the next extension higher & avoid double correction lower.
Source: https://elliottwave-forecast.com/stock-market/spx-reacting-higher-extreme-equal-legs/