Hello traders ! In this technical article, we’re going to take a quick look at the Elliott Wave charts of GOLD (XAUUSD ) , published in the members area of the website.
As our members know, XAUUSD has been showing impulsive bullish sequences in the cycle from 2579.36. We continue to favor the long side in this commodity. Recently, GOLD pulled back and found buyers at the equal legs area.
GOLD (XAUUSD) Elliott Wave 1 Hour Chart 02.21.2025
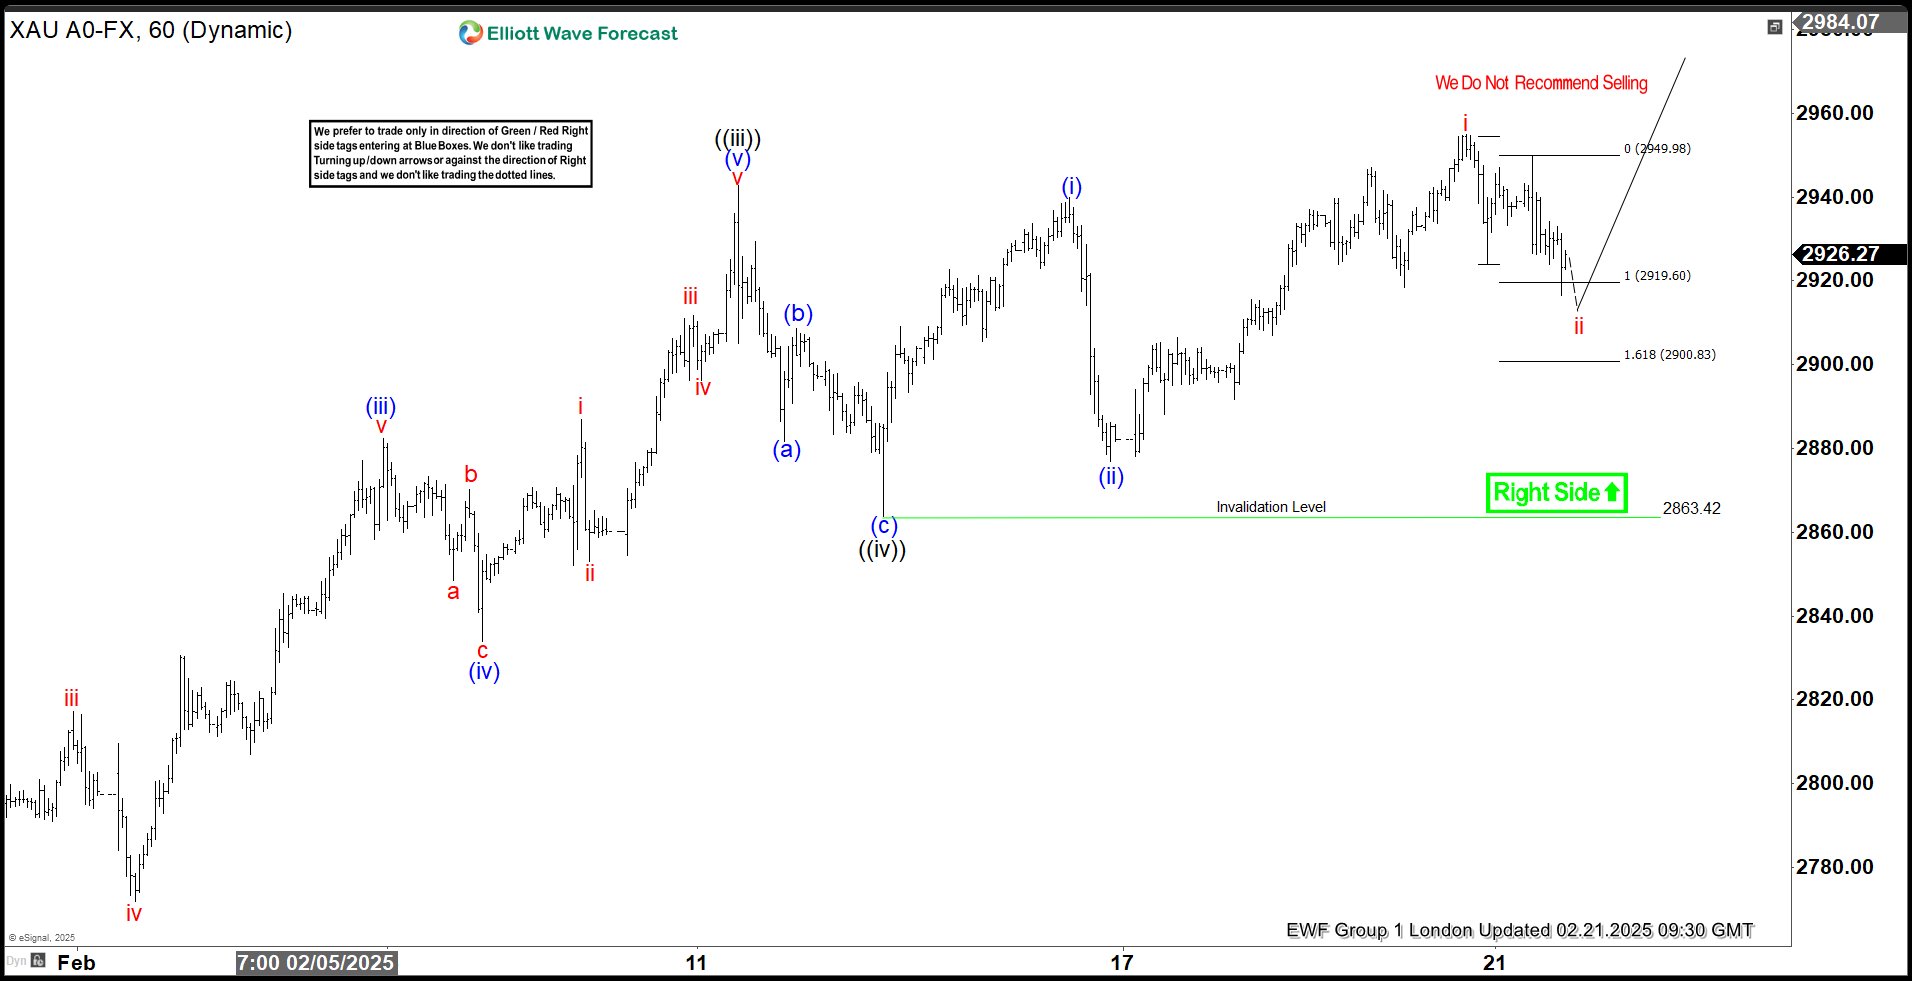
GOLD remains bullish as long as it holds above the 2863.42 pivot in the first degree. Currently, it is showing three waves down from the peak, reaching the extreme zone at 2919.6–2900.83. We expect buyers to step in at this area, leading to either a continuation toward new highs or at least a three-wave bounce.
90% of traders fail because they don’t understand market patterns. Are you in the top 10%? Test yourself with this advanced Elliott Wave Test
GOLD (XAUUSD) Elliott Wave 1 Hour Chart 02.21.2025
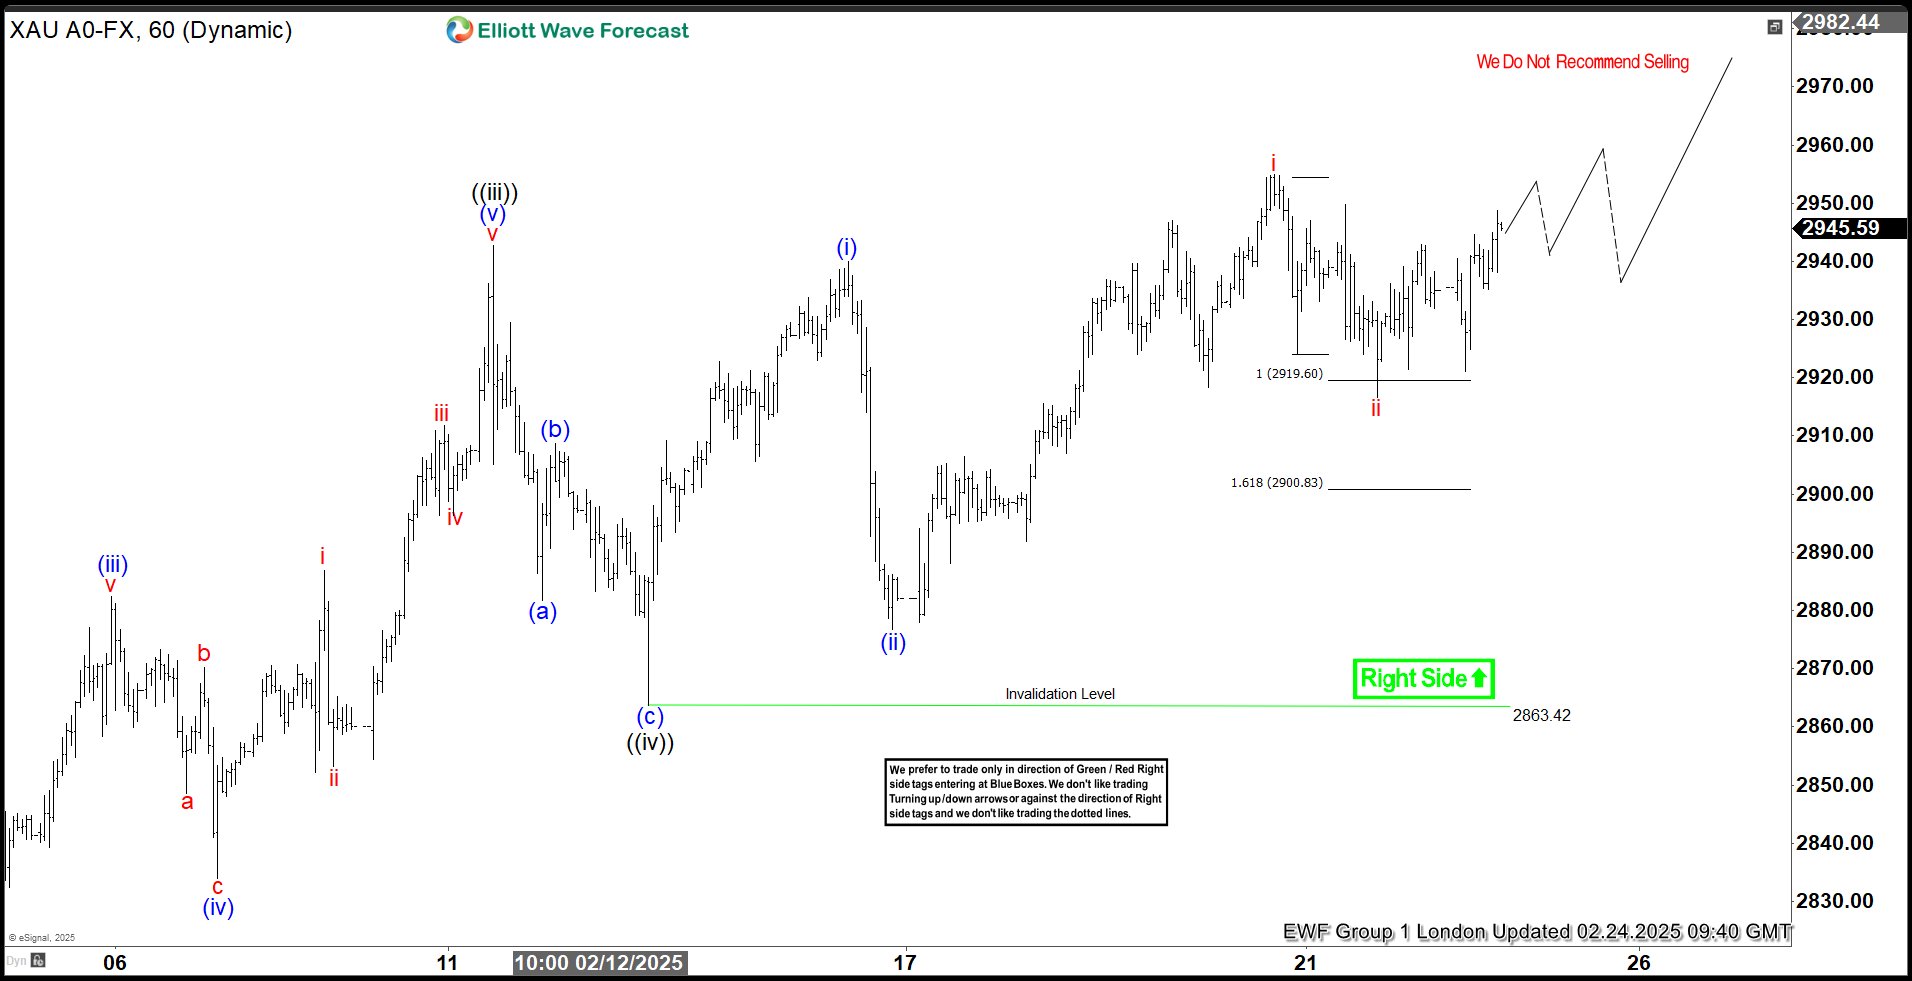
GOLD is showing us nice reaction from the equal legs area (2919.6–2900.83) . The commodity completed 3 waves down at the 2917.16 low. As expected, buyers stepped in, pushing prices higher. Now, we’d like to see a break above the February 20th peak to confirm further upside extension. A break above this level would open the door for a potential move toward the 2994.7+ area.
Reminder for members: Our chat rooms in the membership area are available 24 hours a day, providing expert insights on market trends and Elliott Wave analysis. Don’t hesitate to reach out with any questions about the market, Elliott Wave patterns, or technical analysis. We’re here to help.