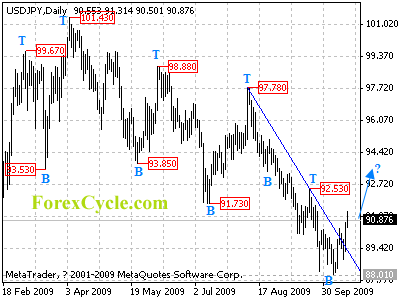
Being contained by 87.12 (Jan 21 low) long term critical support, USDJPY rebounded from 88.01 level and broke above the falling trend line from 97.78 to 92.53, suggesting that a cycle bottom has been formed on daily chart. Further rise to test 92.53 key resistance is now in favor, a break above this level will indicate that the downward trend from 101.43 has completed at 88.01 level already, then the following uptrend will take price back to 94.00 or even higher.
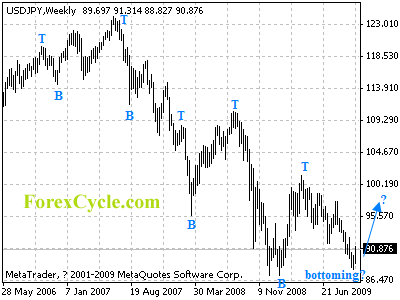
For long term analysis, USDJPY might be forming a cycle bottom at 88.01 level on weekly chart. Key resistance is at 92.53, a breakout of this level will confirm the cycle bottom.


