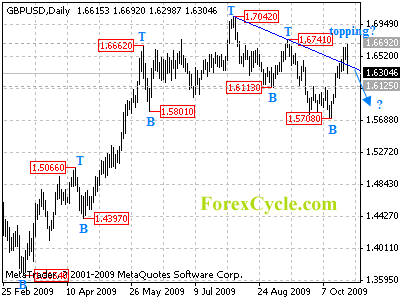
GBPUSD broke above the falling trend line from 1.7042 to 1.6741 and is under pressure by 1.6741 resistance. Now the pair might be forming a cycle top at 1.6692 level on daily chart. Pullback to retest 1.5708 support would more likely be seen in next several days. However, a break above 1.6741 key resistance will indicate that the downward trend from 1.7042 has completed at 1.5708 level, then further rebound towards 1.0742 previous high could be seen to follow.
For long term analysis, GBPUSD has formed a cycle top at 1.7042 level on weekly chart. Further fall to 1.5000 area to reach next cycle bottom is expected in next several weeks.

