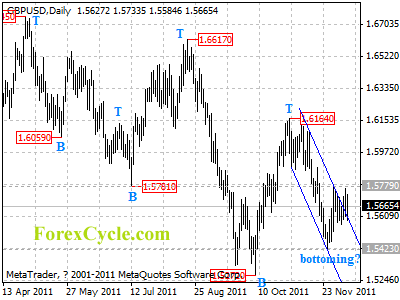
GBPUSD broke above the upper line of the price channel on daily chart, suggesting that a cycle bottom is being formed at 1.5423. Key resistance is at 1.5779, a break above this level will signal completion of the downtrend from 1.6164, then the following upward move could bring price to 1.6500 zone. On the other side, as long as 1.5779 resistance holds, the rise from 1.5423 could be treated as consolidation of downtrend, one more fall to test 1.5272 support is still possible.
For long term analysis, GBPUSD had formed a cycle bottom at 1.5272 on weekly chart. Further rise towards 1.7000 would likely be seen over the next several weeks.


