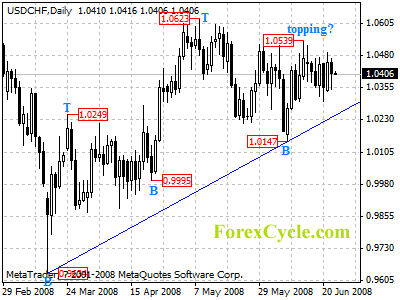
USDCHF might be forming a cycle top at 1.0539 on daily chart. Lengthier consolidation would more likely be seen and pullback to test the support of the up trend line from 0.9634 to 1.0147 is expected. Key support is at 1.0147, a break below this level will turn price back to 0.9850 area. Initial resistance is at 1.0539, rise above this level will indicate that the range trading between 1.0147 and 1.0623 has completed and further rise to 1.0800 area could be seen.
For long term analysis, USDCHF formed a long term cycle bottom at 0.9634 level on weekly chart. Further rise to 1.1200 area is now in favor.


