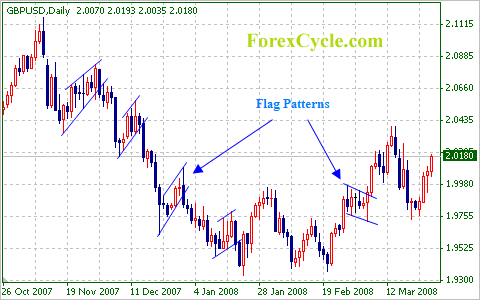
When talking about flag patterns, it probably will remind many traders of wedges and triangles, actually there’s no difference among them – they are short-term continuation patterns. For convenience, we’ll call all these patterns as flag in the rest of the article. Flag is a sharp, strong rise/fall trend with several bars of sideways price action on much weaker trade followed by a second, sharp move to new highs/lows.
Flags, wedges and triangles can be categorized as continuation patterns. They usually represent only brief pauses in a currency pair. They are typically seen right after a big, quick move. The price then usually takes off again in the same direction. Research has shown that these patterns are some of the most reliable continuation patterns.

Flags are short-term patterns that can last from 1 to 12 bars. There is some debate on the timeframe and some consider 8 bars to be pushing the limits for a reliable pattern. Ideally, these patterns will form between 1 and 4 bars. Once a flag becomes more than 12 bars or more, it would be classified as a rectangle.
A flag is a small rectangle pattern that slopes against the previous trend. For a bullish flag pattern, the flag would slope down; a break above resistance indicates that the previous advance is resumed. For a bearish flag pattern, the flag would slope up, a break below support indicates that the previous decline is resumed.
The biggest difference between flags and other patterns is that, flags (wedge or triangle) are usually too short in duration to have any real impact on highs and lows of the price. The price actions are confined within two parallel trend lines, while other patterns are not.
The following indications are important when identifying flags.
- Flag patterns occur when a market makes a very strong up /down trend in prices, followed by a pause or sideways trading for a few price bars; if the distance of the flagpole is limited, flag will be less typical.
- Do pay special attention to the slope of flags: if the slop is consistent with the trend, it’s highly possible that it is not a continuation patterns, but an exhaustion of current trend, full of risk of reversion.
- The duration of flag. If the duration is longer than others in current trend, the trend is very near to the end; discretion is advised.
