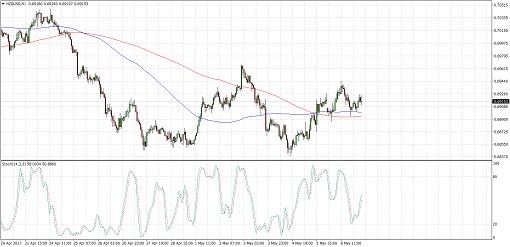
NZDUSD could be in for a reversal from its selloff as the pair formed a double bottom pattern on its 1-hour chart. Price still has to test and breakout from the neckline at the .6960 level before confirming that an uptrend is in order.
The chart pattern is approximately 100 pips tall so the resulting breakout could be of the same size. The 100 SMA just crossed above the longer-term 200 SMA on this time frame so the path of least resistance is to the upside. Also, stochastic is pointing up and heading north so NZDUSD might follow suit.
However, US economic reports have been mostly stronger than expected in the past few days as the NFP report printed a higher than expected 211K gain in hiring versus the estimated 194K reading. Also, the Fed labor market conditions index enjoyed a large upgrade from 0.4 to 3.6 in March.
The main catalyst for this short-term setup might be the RBNZ decision, which could show a slight shift to a less dovish bias. Economic reports from New Zealand have been coming in mostly stronger than expected while the latest Global Dairy Trade auctions have reflected gains in dairy prices.

No actual policy changes are expected from the RBNZ this month so traders will pay close attention to any changes in rhetoric. Meanwhile, the US has its CPI and retail sales reports lined up at the end of the week.
By Kate Curtis from Trader’s Way

