Hello fellow traders. In this technical blog we’re going to take a quick look at the past Elliott Wave charts of Dollar Index . We’re going to take a look at the price structures of USDX , count the swings and explain the forecast.
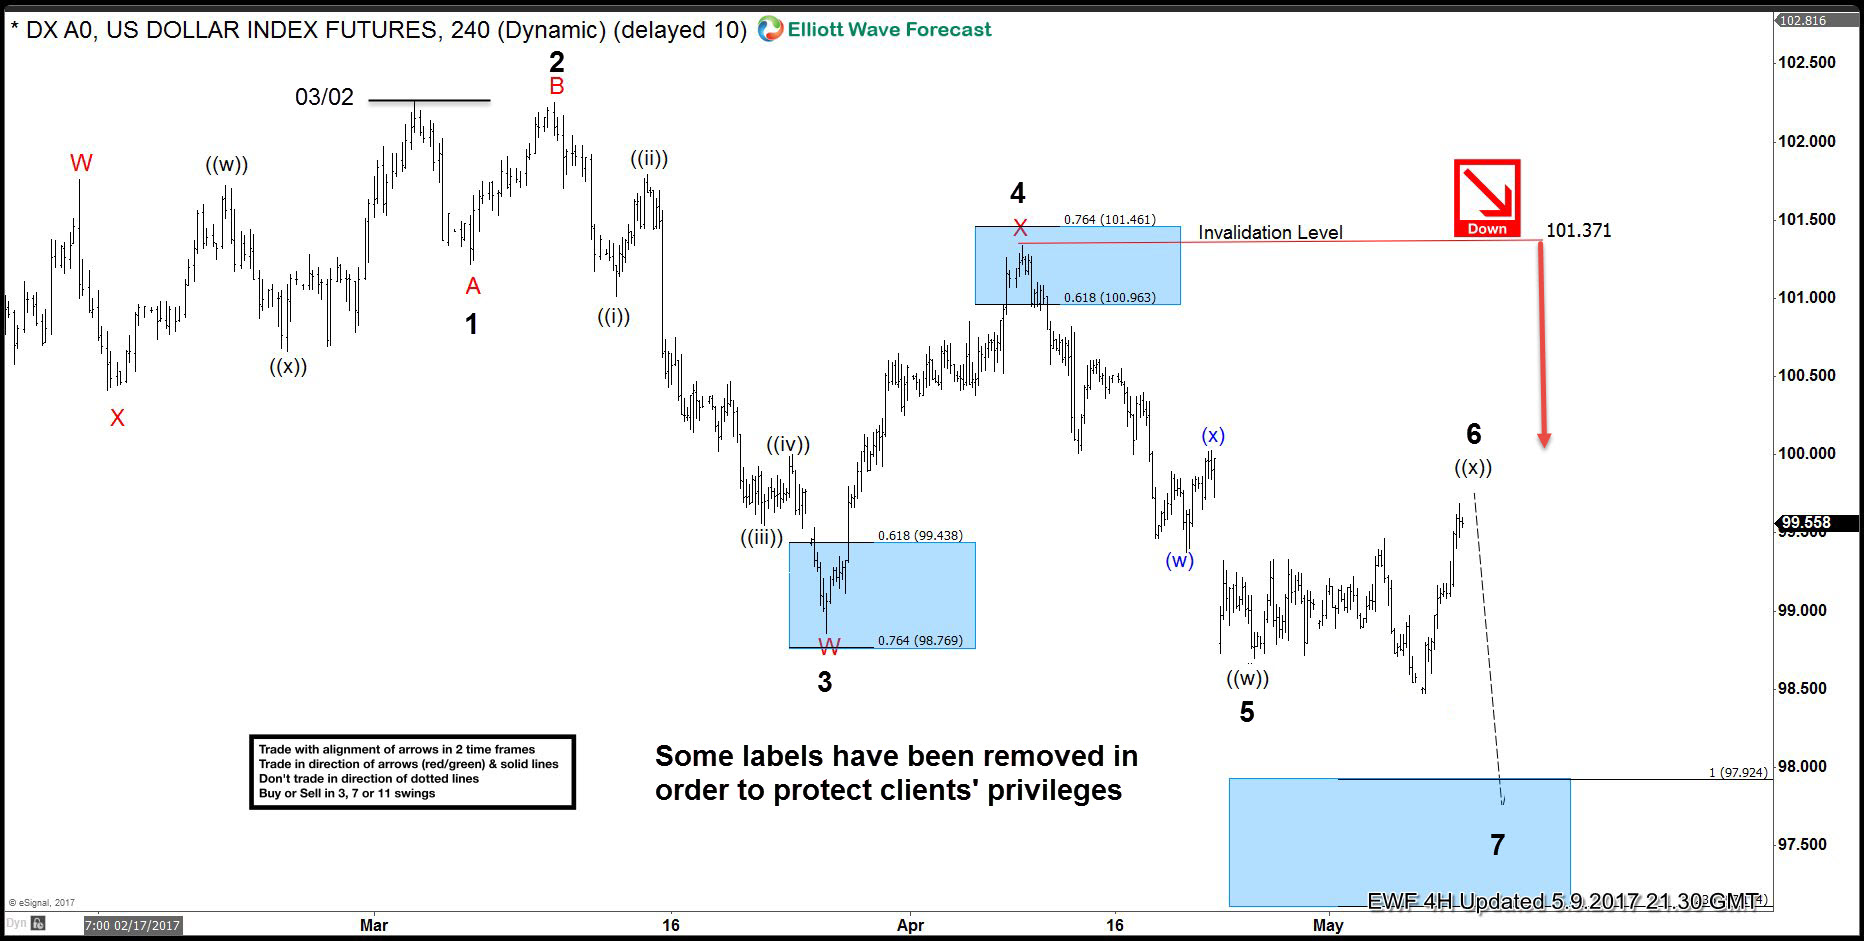
USDX 4 hour update 05.09.2017
As our members know, we were pointing out that USDX is having incomplete bearish swings sequnces within the cycle from the 03/02 peak. From the chart below, we can see that USDX has a clear 5 swing from the peak, when we’re about to complete 6th swing as Irregular Flat. Consequently, we’re calling further weakness once proposed Flat is complete. Dollar index is targeting 97.92-96.91 area ideally.
Now let’s take a look at the short term structures…
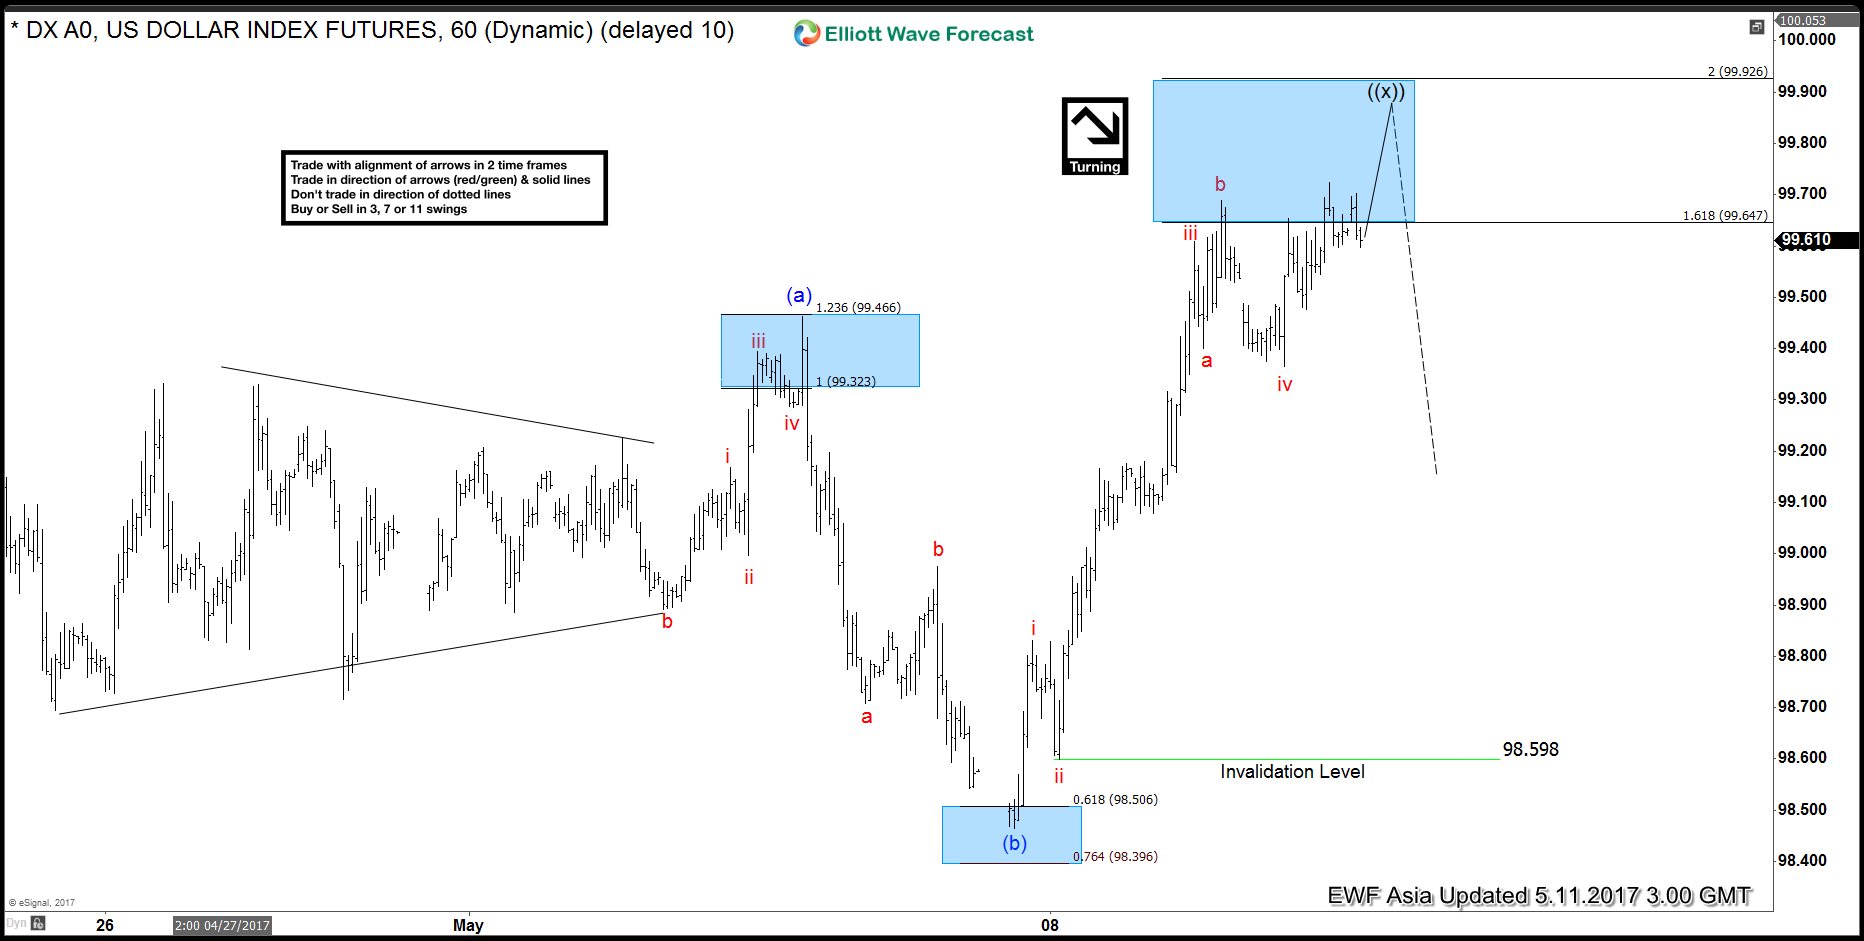
USDX 1 Hour Asia Chart 05.11.2017
Dollar Index is about to complete wave ((x)) recovery as expanded flat structure. We got clear 5 waves from the lows that is part of wave (c) of flat. Although, the extreme area is reached at 99.64 -99.92, and we have minimum requirements for correction to complete soon, we see possibility of marginal extension higher within the blue box still.
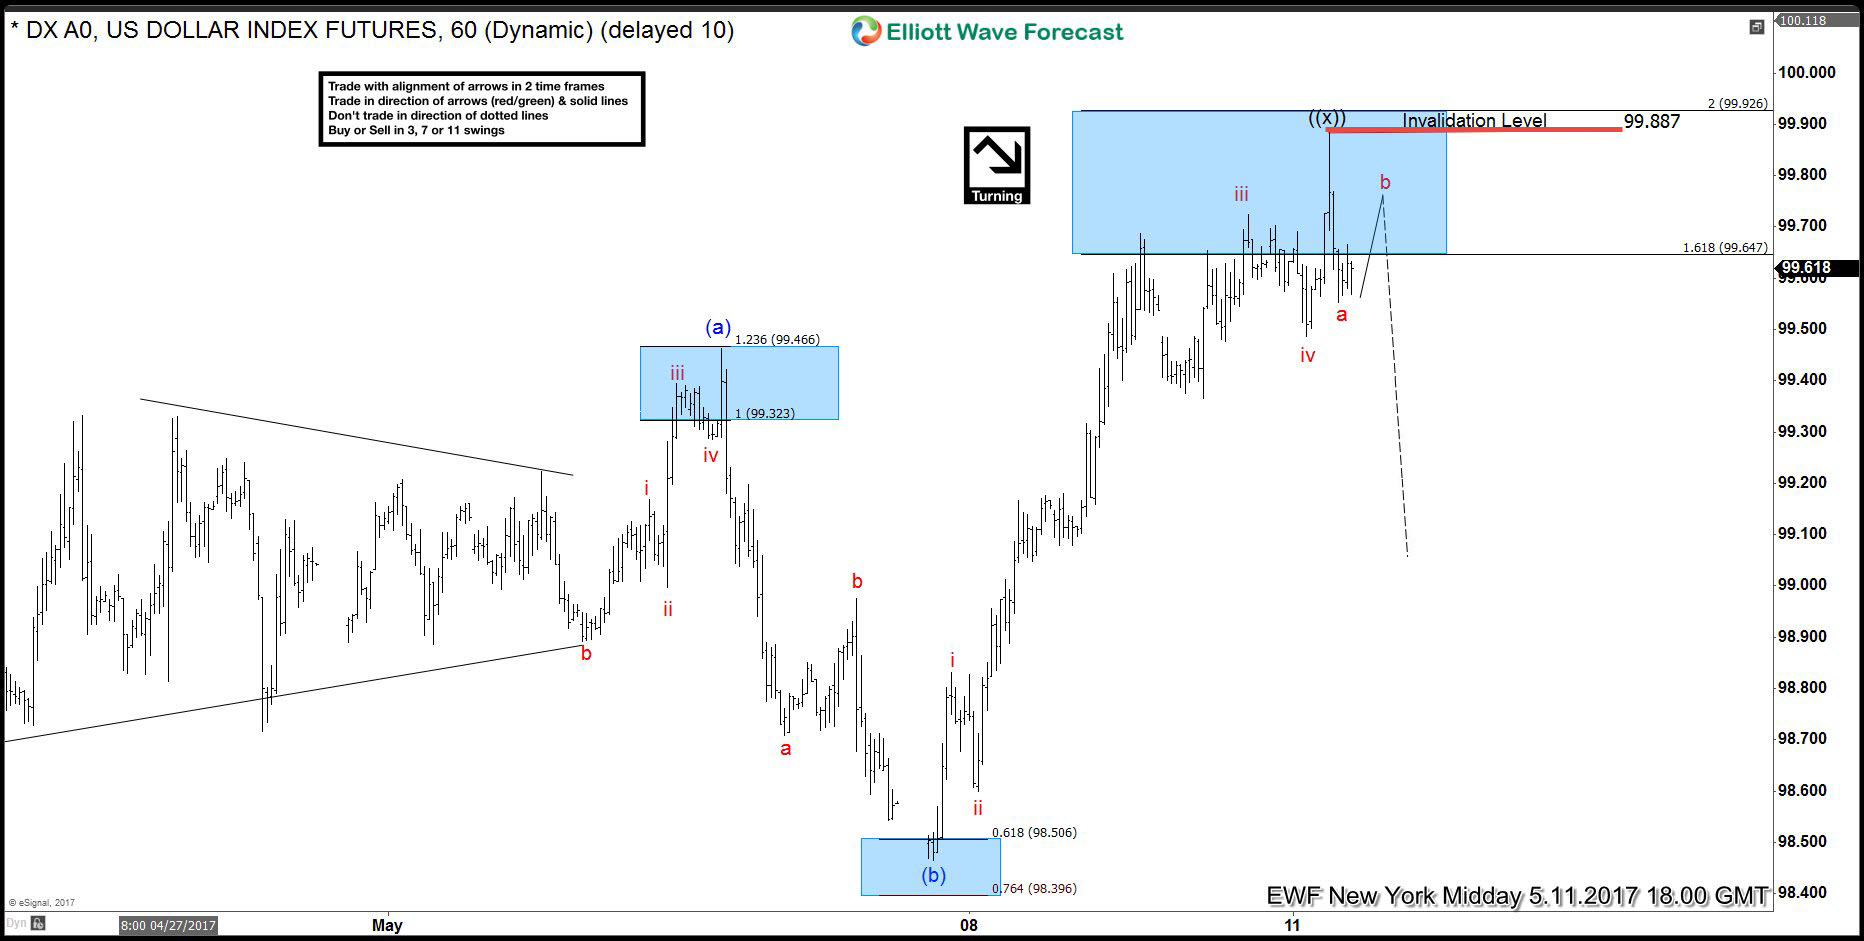
USDX 1 Hour NY Midday Chart 05.11.2017
We got expected marginal extension and reaction from the blue box. Now we’re calling wave ((x)) recovery completed at 99.88 peak as expanded flat. While the price stays below 99.88 peak further weakness should ideally follow.
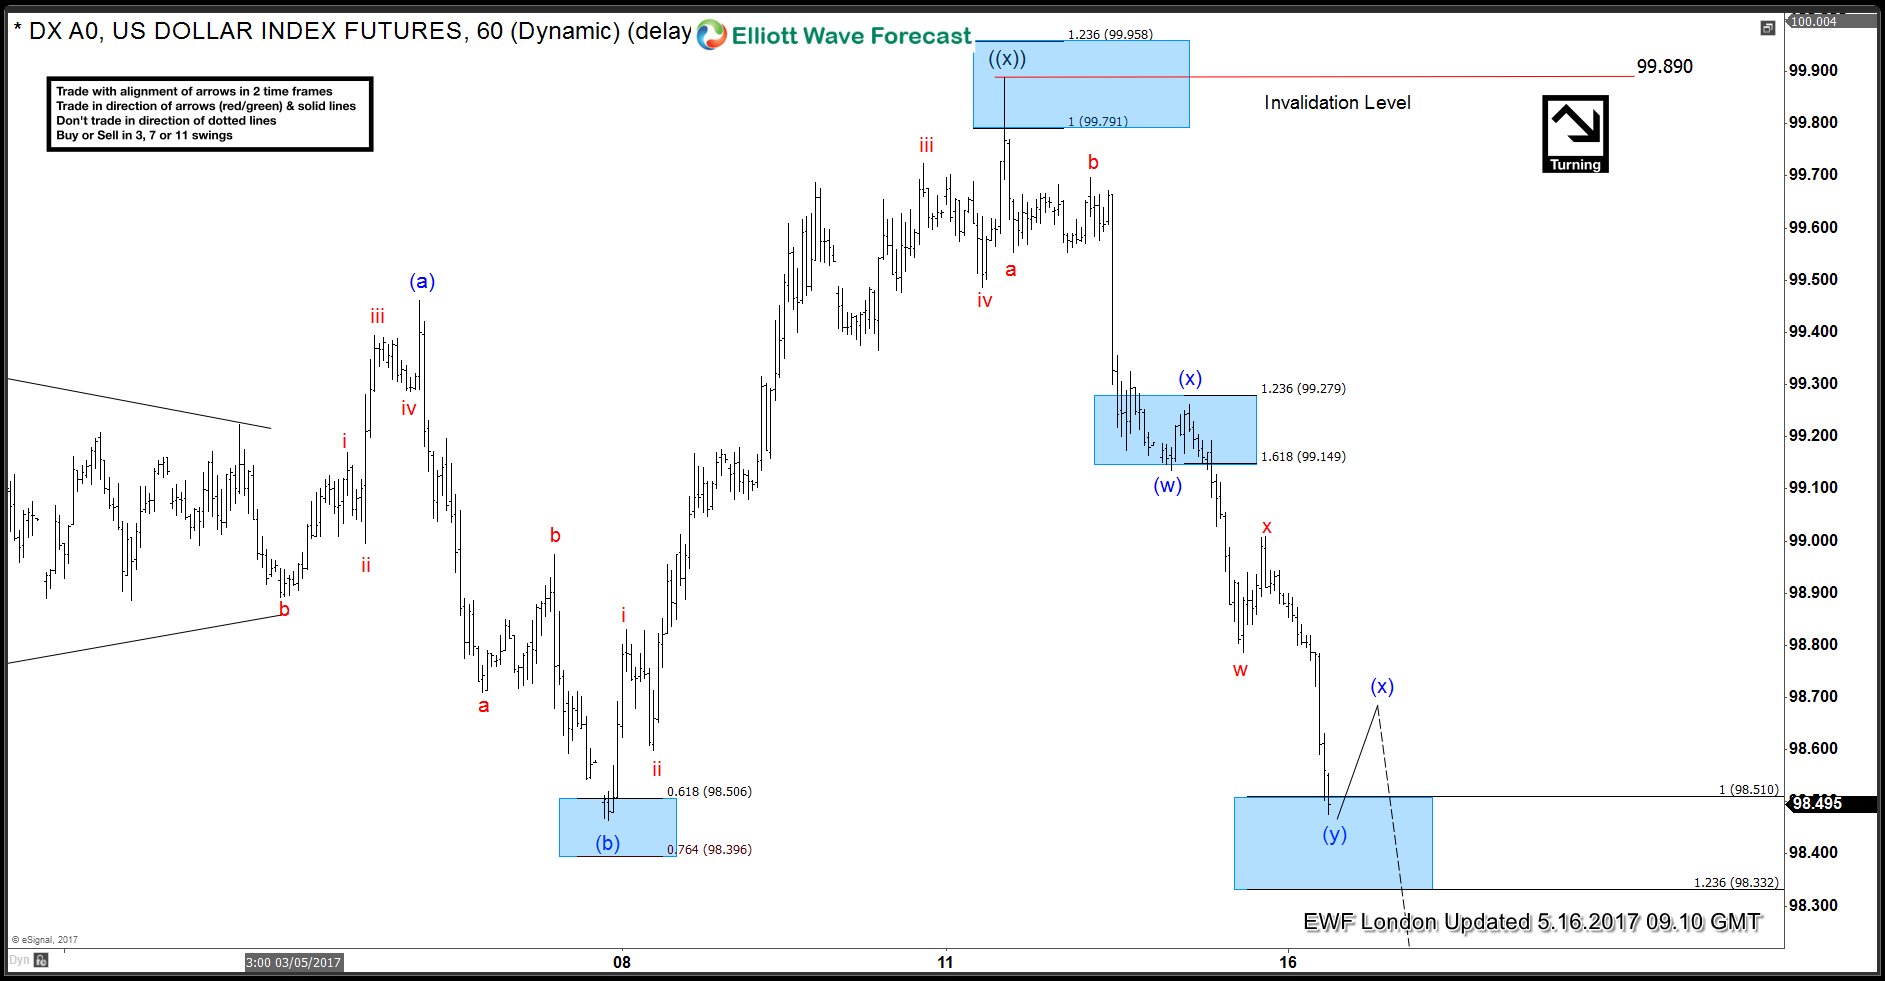
USDX 1 Hour London Chart 05.16.2017
99.88 peak held nicely and USDX is now breaking lower, suggesting more downside in 7th swing towards proposed 97.92-96.91 area.
Source : https://elliottwave-forecast.com/elliottwave/usdx-forecasting-decline-flat


