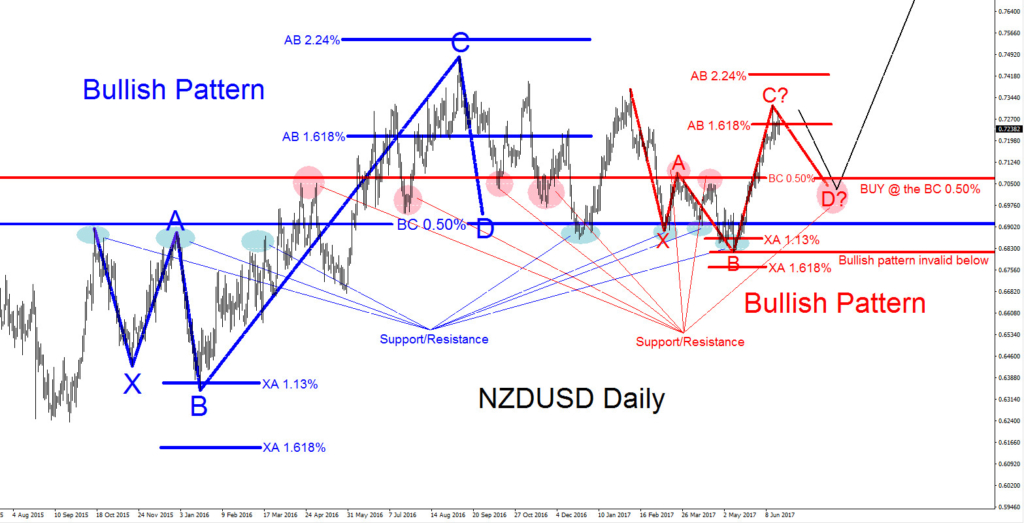
NZDUSD is showing 2 bullish patterns on the daily chart so we are expecting for the pair to continue higher. A move lower will now give bulls a chance to push the pair higher. Below we will show the possible bullish scenarios where bulls can enter the market and catch the move higher.
NZDUSD Daily Chart 2 Possible Bullish Patterns: Traders need to wait for NZDUSD to terminate red point C between the red AB 1.618% – AB 2.24% Fib. levels. A move lower from the suggested area to the red BC 0.50% Fib. retracement level will trigger BUYS. As long as price stays above the red point B low, watch for NZDUSD to make another swing higher. There is also strong support/resistance at the red BC 0.50% area which will allow a possible bounce higher. Watch for move higher towards the blue AB 2.24% Fib. level.
If looking to buy NZDUSD we prefer waiting for a retracement/pullback to trigger the red point D sell at the BC 0.50%. Stops should be placed at 0.6816 (point red B low) and should be bought at the BC 0.50% Fib. level minimum for a better risk/reward trade with targets above the blue AB 2.24% Fib. level.
Of course, like any strategy/technique, there will be times when the strategy/technique fails so proper money/risk management should always be used on every trade.
Source : https://elliottwave-forecast.com/aidans-corner/nzdusd-wait-pullback-buy


