Bank of Canada will have a meeting on July 12 to decide the interest rate. USDCAD has declined due to recent comments made by top Bank of Canada officials which seem to suggest that interest rates could be raised soon. The market in fact is pricing in an 82 percent chance of a rate hike next week. In a CNBC interview last week, Bank of Canada Governor Stephen Poloz said that the two interest rate cuts by Bank of Canada in 2015 have done their jobs in shielding Canadian economy from the steep fall in the price of oil. He also added that the central bank needs to consider its options as excess capacity in the economy is used up.
Mr. Poloz reiterated his hawkish stance in a recent interview with German newspaper Handelsblatt. He said that monetary policymakers must “anticipate where the economy will be 18 or 24 months from now”. He also said inflation in Canada should be well into an uptrend by the first half of 2018. Thus normalization must begin before the price growth hits its target.
The Canadian dollar strengthened against the U.S dollar on Tuesday after his comments. The loonie touched its strongest intraday level in nine months at 1.2908. The strength in loonie is not only based on rate hike expectation alone. Recent economic data also shows Canada’s economy grew for sixth consecutive month in April. Meanwhile, business sentiment suggest companies feel more optimistic. Prices of oil, one of Canada’s major exports, also started to recover. This further adds support for the Canadian dollar.
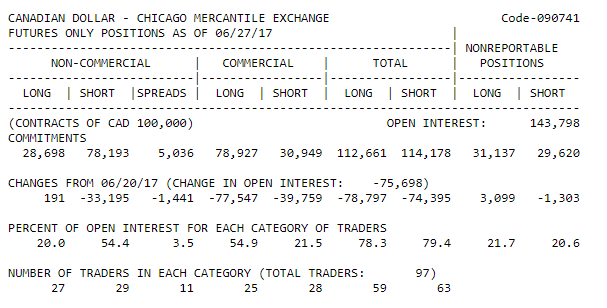
Data from CFTC (U.S Commodity Futures Trading Commission) shows a record pace of short covering in the Canadian dollar for a fifth straight week. The June 27 COT (Commitment of Traders) report below shows non commercial’s net short positions in Canadian dollar dropped to 49,495 contracts from 82,881 a week earlier. With the net short position remains elevated at 50K, CAD remains vulnerable to short squeeze and position adjustment.
USDCAD Long Term Analysis
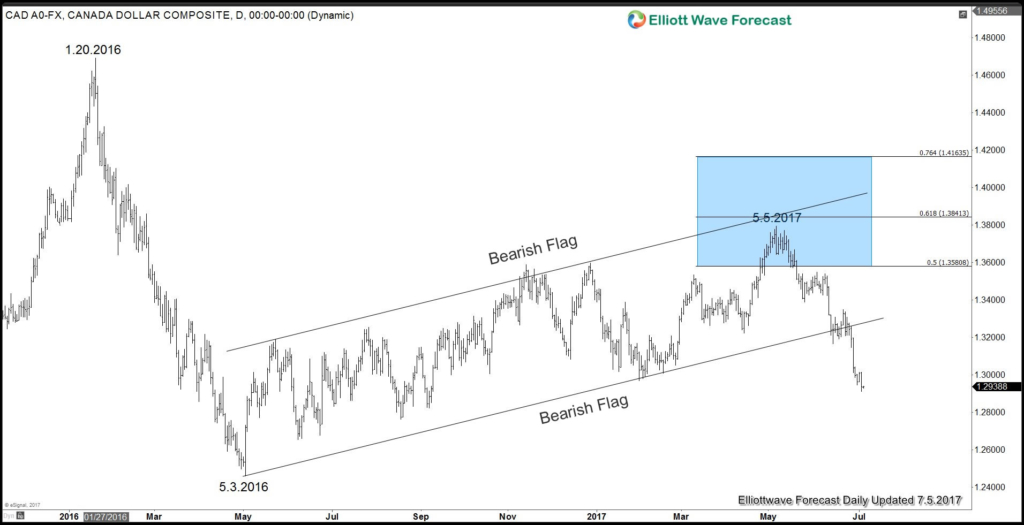
Daily USDCAD chart above shows pair declined sharply after reaching the peak on January 20, 2016. Pair declined from 1.4693 to 1.2461 (approximately 2200 pips) within a span of less than 4 months. The decline finally bottomed on May 3, 2016. The pair then took 1 year time from May 3, 2016 to May 5, 2017 to correct the decline in overlapping fashion, characteristic of a correction. This correction looks to be forming a bearish flag and recently pair has broken below the channel which may suggest that the correction is complete on May 5, 2017. A break below May 3, 2016 low (1.2461) will give the final confirmation that pair has started the next leg lower.
USDCAD 4 hour Elliott Wave Sequence Chart
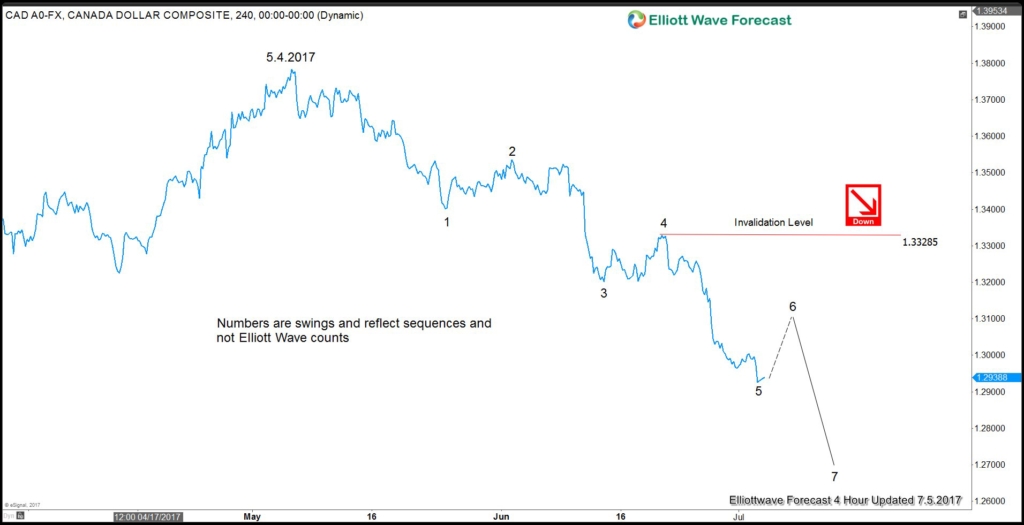
USDCAD 4 Hour chart above shows a 5 swing bearish sequence from May 4, 2017 high. Please note that this is not the same as 5 waves impulse, but rather the number of swing count. The 5 swing sequence suggests that while the sixth swing bounce fails below swing #4 high at 1.3328, more downside can be seen in the pair.
As the market is dynamic, traders need to keep up with the most up-to-date analysis of their favorite instrument. Successful traders need to have a good trading system and also strict risk management with rules that define entry, stop loss, and take profit levels with high accuracy to allow traders to get into a risk free position in your trade as quickly as possible.
Source : https://elliottwave-forecast.com/forex/usdcad-forecast-into-boc-meeting


