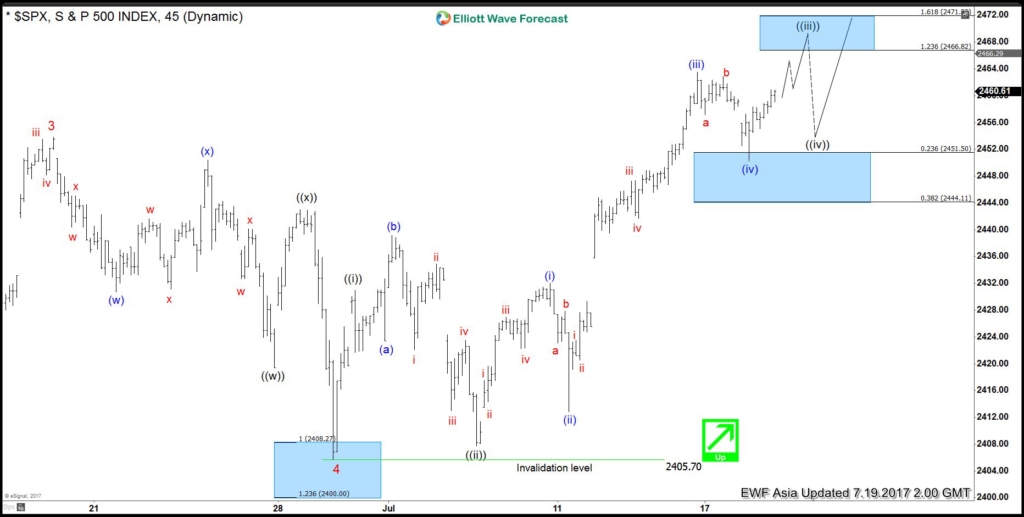
Short term SPX Elliott Wave view suggests the rally from 5/18 low (2352.7) to 6/19 peak (2453.8) ended Minor wave 3. The pullback from 2453.8 to 2405.70 on 6/29 low ended Minor wave 4. Up from there, the rally is unfolding as an impulse Elliott Wave structure with extension. This 5 waves move could be Minute wave ((a)) of an Elliott wave zigzag structure where Minute wave ((i)) ended at 2431 and Minute wave ((ii)) ended at 2407.7.
Minute wave ((iii)) is subdivided into another impulsive waves of a smaller degree. Minutte wave (i) ended at 2432, Minutte wave (ii) ended at 2412.8 and Minutte wave (iii) ended at 2463.5. Below from there Minutte wave (iv) ended at 2450.34 and above from there Minutte wave v of ((iii) is in progress towards 2466.82-2471.8 area. Afterwards, the Index should pullback in Minute wave ((iv)) before further upside, provided that pivot at 2405.70 low remains intact.
In case of further extension in Minutte wave (v) of ((iii)), the index could extend to (v)=(i) target area at 2474.7-2480.4 before a turn in Minute wave ((iv)) happens. If the pullback turns out to be rather strong then the Index could already end the cycle from 6/29 low (2405.7) as an Elliottwave Flat structure, and it should then correct the cycle from 6/29 low before the rally resumes. We don’t like selling the Index and favors more upside as far as pivot at 2405.70 low remains intact.
SPX 1 Hour Elliott Wave Chart
Keep in mind that the market is dynamic and the view could change in the mean time. Success in trading requires adequate risk and money management, as is the understanding of Elliott Wave theory, cycle analysis and correlation. We have developed a very sensitive trading strategy that defines entry, stop loss and take profit levels with high accuracy and allows you to take risk free position shortly after taking it by protecting your wallet.
Source : https://elliottwave-forecast.com/stock-market/spx-elliott-wave-view-showing-impulse


