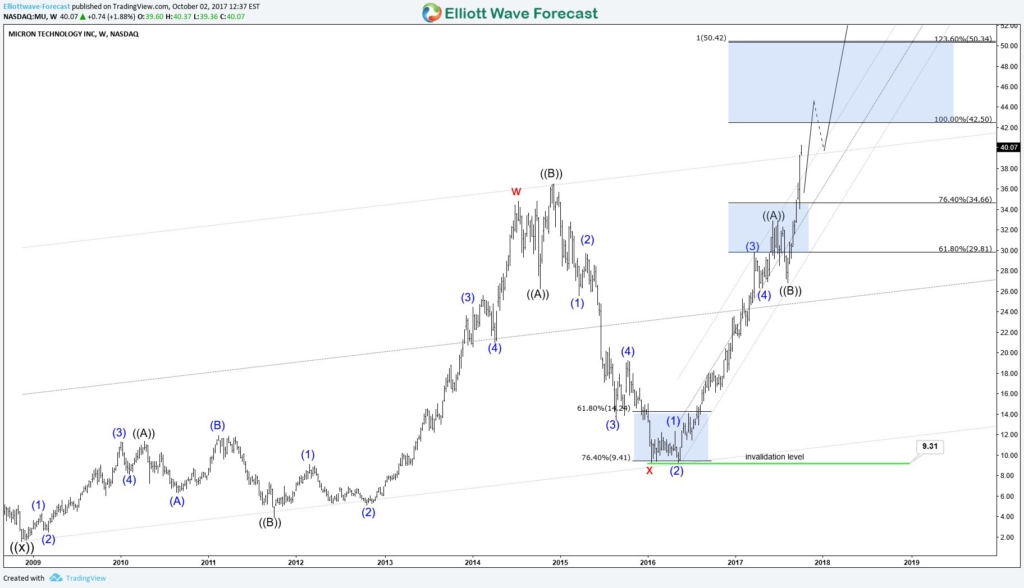
Today we are going to take a look at the weekly chart of the MU Micron Technology Inc. stock which shows a very interesting price structure.
Before we proceed with the analysis, few words about the company. According to Wikipedia, Micron Technology Inc. is an American global corporation based in Boise, Idaho. Furthermore the company produces many forms of semiconductor devices, including dynamic random-access memory, flash memory, and solid-state drives. It’s consumer products are marketed under the brands Crucial Technology and Lexar. Micron and Intel together created IM Flash Technologies, which produces NAND flash memory.
By looking at the Stock price, 2016 and 2017 have been great years for MU. The stock has achieved an 400% parabolic extension to date from the lows at 9.31. The surge in the stock’s price is affiliated mostly to the company’s revenue growth in both sequential and annual basis.
We won’t get into more details with Micron’s very good economic condition but instead focus on the company’s stock.
MU Micron Technology – Weekly Chart
The MU stock has a bullish incomplete sequence from the 11/17/2008 lows at 1.59. Additionally has a bullish sequence from the 2016 lows as well indicating 5 waves for wave ((A)). The 2008 sequence is in effect after breaking above the 12/2014 peak at 36.59. The second after taking the ((A)) peak at 32.33. After short term pull backs the Stock should continue extending higher until reach the equal legs – 1.236% extension of the w – x in red swing at the 42.50’s – 50.34 zone. Additionally, the stock should extend to the 2016 cycle ((A)) – ((B)) equal legs – 1.236% extension to the 50.34 – 56 zone.
From there we should see a larger degree pull back in (x) but at this point to soon to create any calls for that correction.
Source : https://elliottwave-forecast.com/stock-market/mu-micron-technology-buy-next-dip/


