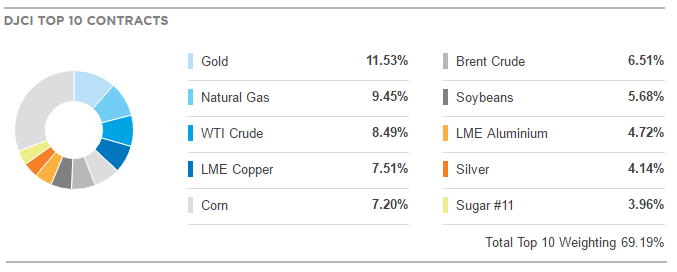
The Dow Jones Commodity Index is a broad measure of the commodity futures market that emphasizes diversification and liquidity through a equal-weighted approach. It doesn’t allow any sector to make up more than 33% of its portfolio or any single commodity to make up more than 15%.
Gold is the top weighted commodity of the index with 11.53%, silver only represent 4.14% and Copper 7.51%. Consequently, a total of 23% for metals means that any significant move in that sector should be reflected on the price of DJCI therefore we can use to identify the global trend for commodities around the world.
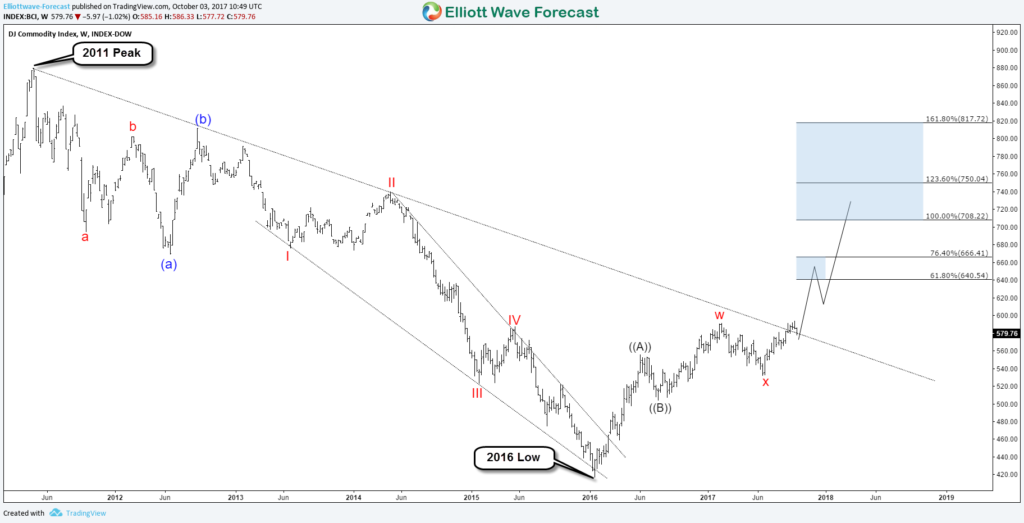
DJ Commodity Index Weekly Chart
From 2011 peak, the Commodity Index traded lower in a regular flat structure which ended at January 2016 low. Up from there, DJCI started a new bullish cycle showing an incomplete 5 swings bullish sequence and it’s suggesting a move higher toward equal legs area 708 – 750 as long as it stays above the recent June 2017 low.
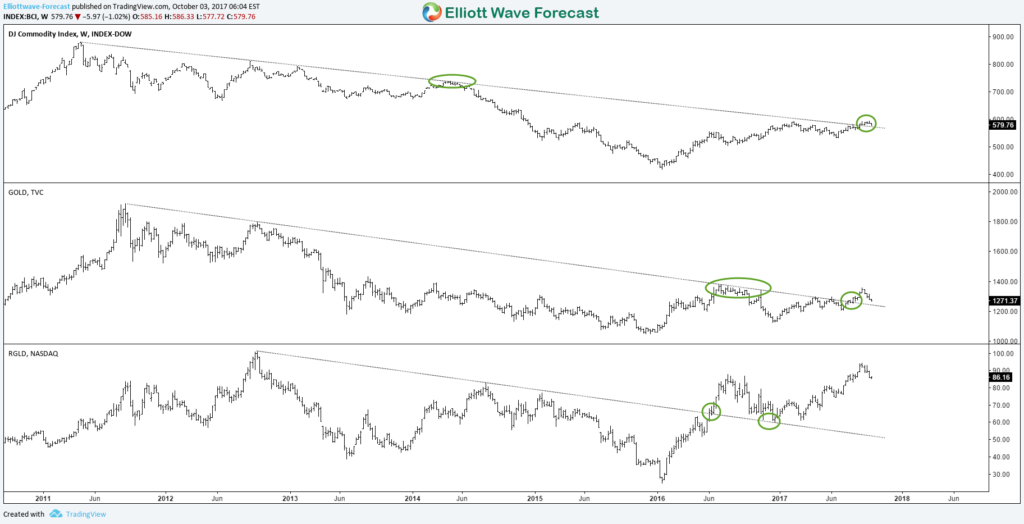
DJCI vs GOLD vs RGLD
In the above charts, we can notice DJCI is breaking above the 2011 bearish trend-line same as Gold and a related mining stock RGLD. The move is supporting the case for higher commodities in the future especially strong move for Gold.
The precious metal is leading the pack higher as many Gold instruments have a bullish sequence / structure like Royal Gold Stock giving us clues about the next investing opportunity in the stock market
Recap:
The DJ Commodity Index is one of many other indexes that can be used to determine the next move for this sector and as a result of the recent bullish breakout it will give a big boost to the rest of commodities.
Source : https://elliottwave-forecast.com/commodities/dj-commodity-index-supporting-gold/


