United States Steel Corporation (NYSE: X) is the second largest steel domestic producer behind Nucor Corporation (NYSE: NUE) and also the world’s 24th largest steel producer.
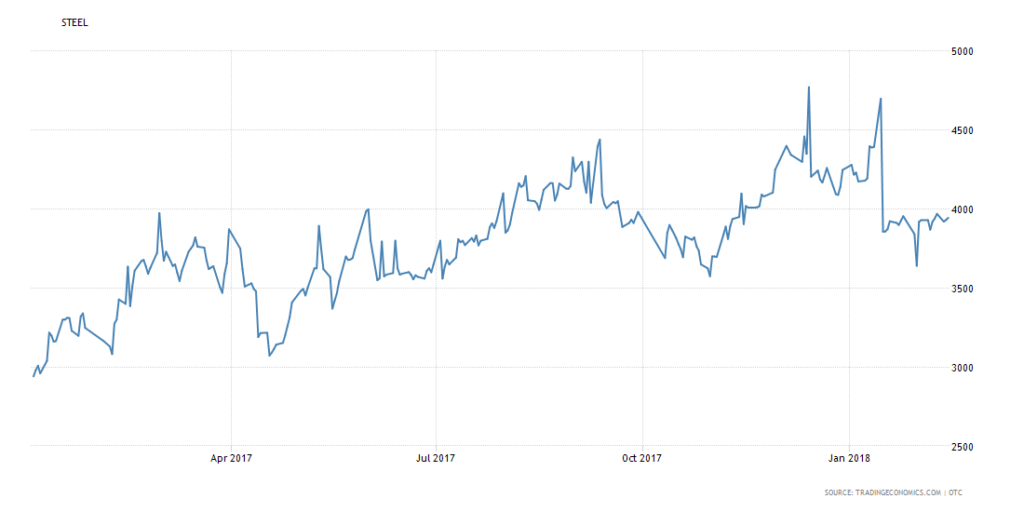
Last year, Steel price surged higher reaching new all time high of 4772 in December gaining +60% before a correction took place. The price is expected keep rising in the coming years as the demand for steel in critical industries keeps increasing.
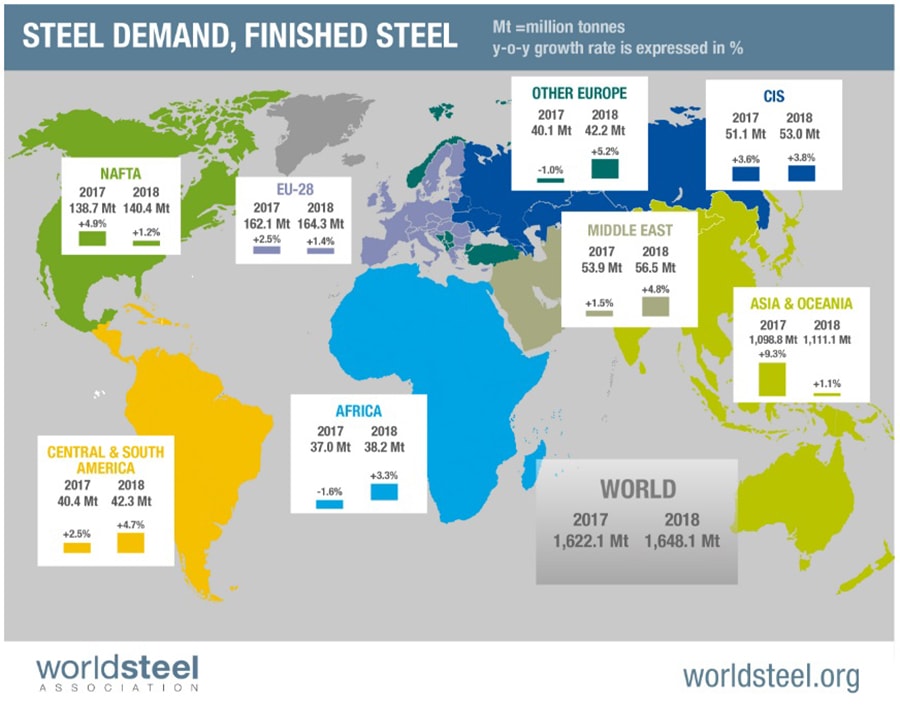
The world global steel production growth rate increased by 5.3% which is one of the major factors helping the related companies to continue its growth.
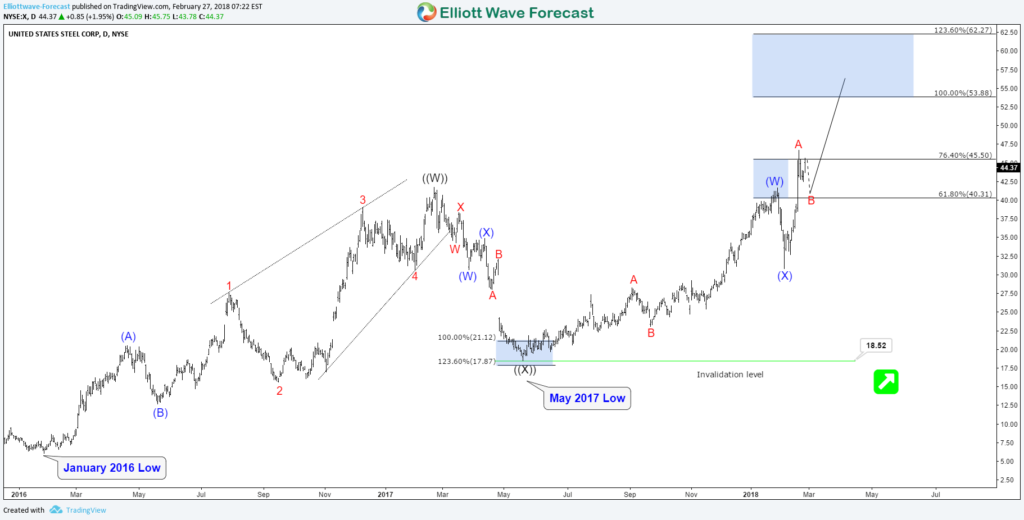
During this month, the United States Steel Corporation stock X price surged 30% breaking above 2017 peak as the move accelerated after the U.S. Department of Commerce recommended metal import tariffs for the federal government.
The current Elliott Wave count for the stock is suggesting a double three structure taking place from January 2016 low and it’s also showing an incomplete 5 swing bullish sequence from May 2017 low. Both bullish cycles have a target around equal legs area $53 -$62 and as long as the stock remain above the recent February low $30.9 then it should continue it’s move to the upside.
X Daily Chart 2.27.2018
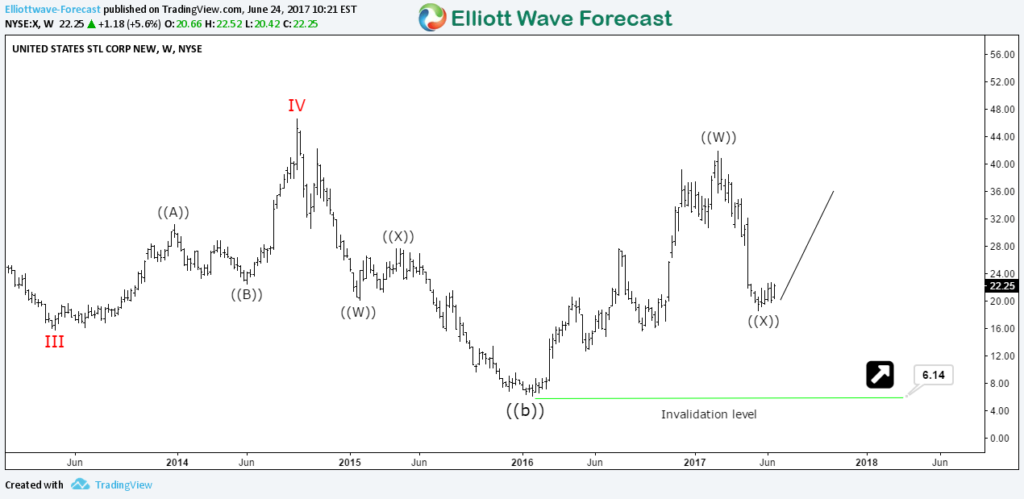
Last year, despite X loosing more than 50% during the correction lower , we expected the stock to remain supported and continue the rally similar to the one from 2016 low as the commodity sector has ended a multi-year correction from 2011 peak.
X Weekly Chart 24.6.2018
The current expected move higher in X will be supported by the fact that the Dow Jones Iron & Steel Index DJUSST is also sharing the same bullish sequence from 2016 low and both instrument should be rallying together during 2018 before reaching the target higher then ending that cycle. Consequently, investors and trader can still look for buying opportunities in any steel stock like X or NUE in 3 , 7 or 11 swings.
Source : https://elliottwave-forecast.com/stock-market/united-states-steel-x-elliott-wave-view/


