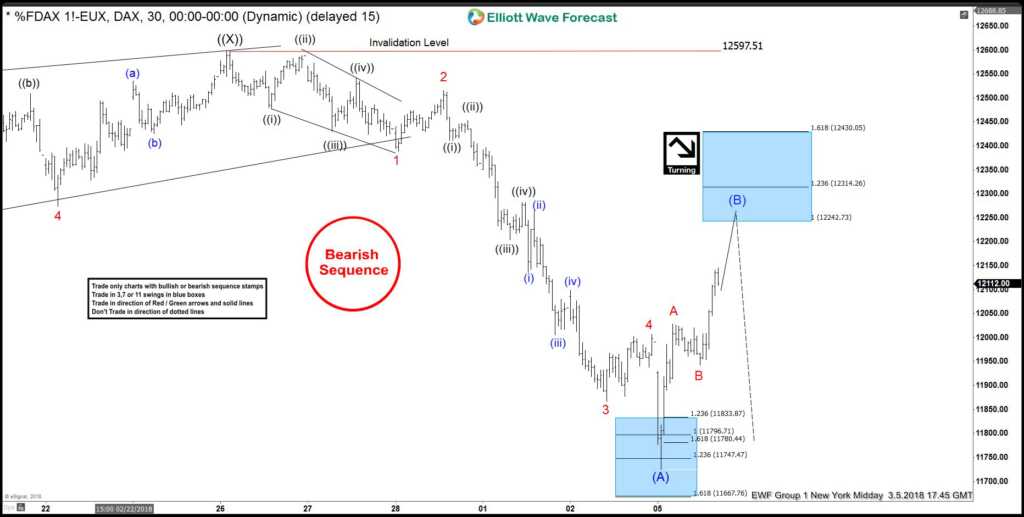
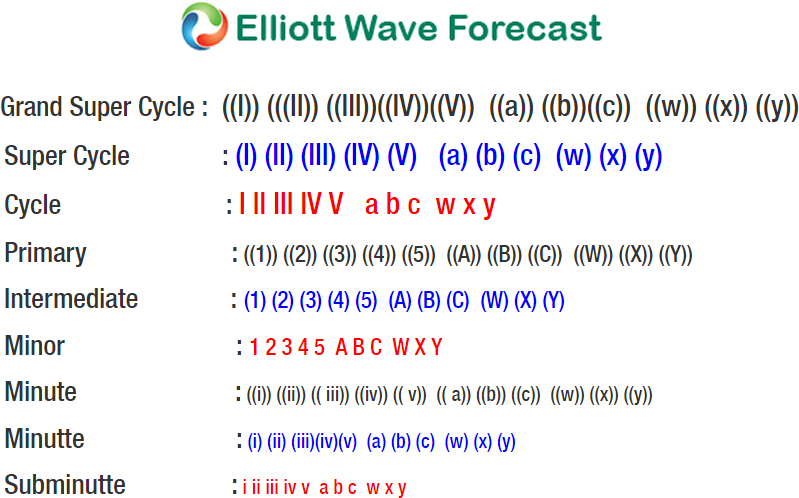
DAX, the index from Germany, is correcting higher degree cycle from February 2016. Short-term Elliott Wave view suggests that the rally to 12597.51 at February 26.2018 ended Primary wave ((X)). Down from there, the decline unfolded as a 5 waves Elliott Wave Impulse Sequence which ended at 11730.50 and this 5 waves ended Intermediate wave (A) of a Zigzag structure in the higher degree. Zigzag structure is a 5-3-5 sequence and according to Elliott wave theory, after ending the first 5 waves, there should be a correction against the first leg in 3, 7 or 11 swings. The correction should then fail & extend in another 5 waves into the direction of first leg, i.e either Higher/lower. In DAX case, Intermediate wave (B) bounce should fail below 12597.51 high in 3, 7 or 11 swings for another extension lower in Intermediate wave (C) lower.
The internals of the decline from 12597.51 high ended Minor wave 1 at 12388, Minor wave 2 ended at 12515.5, Minor wave 3 ended at 11867, Minor wave 4 ended at 12006.50, and Minor wave 5 of (A) ended at 11725. The Index is currently correcting the cycle from 12597.51 high in Intermediate wave (B) bounce as Elliott Wave Zigzag correction, where Minor wave A ended at 12028 and Minor wave B ended at 11942.5. Above from there, Minor wave C of (B) remains in progress and expected to find sellers at 12242.73-12314.26, which is the 100%-123.6% Fibonacci extension area of A-B. The Index should extend lower in Intermediate wave (C) lower as far as pivot from February 26, 2018 peak (12597.51) remains intact. Also, it’s important to note that the 1-hour Chart below is showing bearish sequence tag, which represents the incomplete sequence to the downside. We don’t like buying it and once it reaches 12242.73-12314.26 100%-123.6% Fibonacci extension area of A-B, we are expecting sellers to appear again for 3 waves reaction lower at least.
DAX 1 Hour Elliott Wave Chart
Source : https://elliottwave-forecast.com/stock-market/dax-elliott-wave-view-calling-another-extension-lower/


