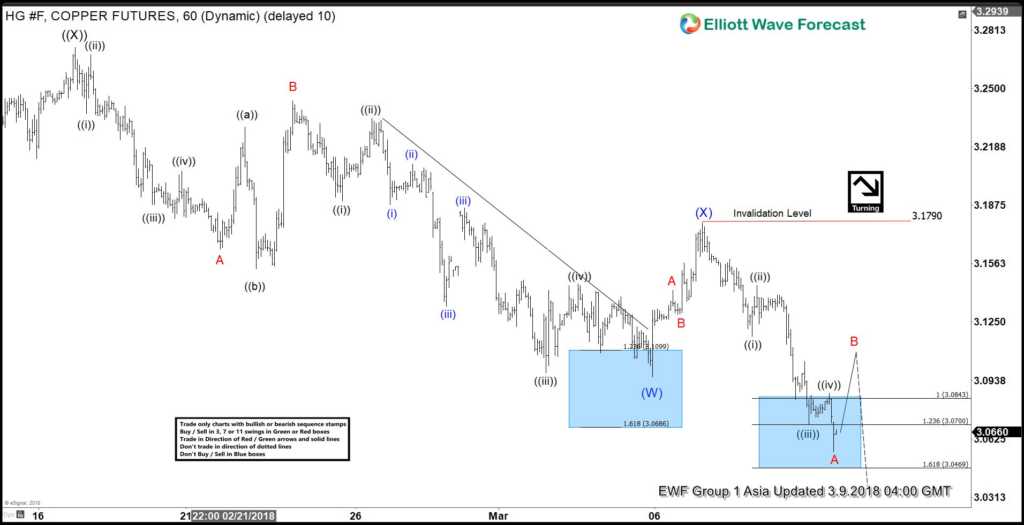
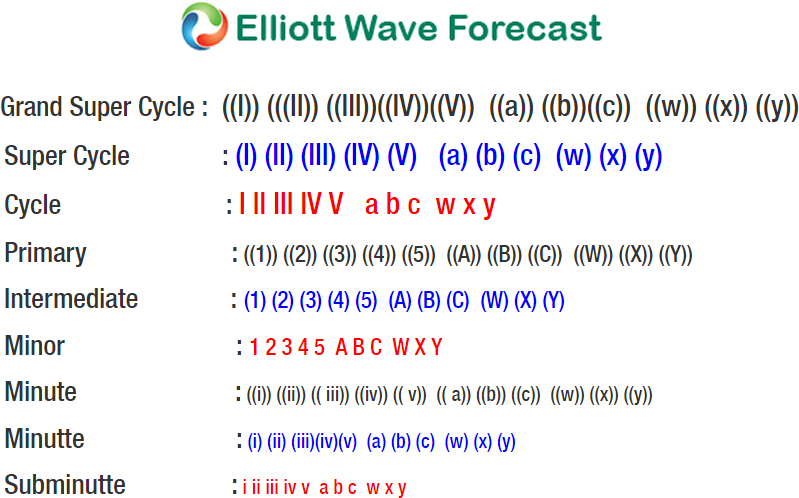
Copper (HG_F) broke below $3.5 low ($3.095) earlier today. As a result, it shows a bearish sequence from 2/16 peak ($3.272), risking for further downside. Current short term Elliott Wave view in Copper suggests that the rally to $3.272 on 2/16 ended Primary wave ((X)). The decline from there is unfolding as a double three Elliott Wave structure where Intermediate wave (W) ended at $3.0955 on 3/5 and Intermediate wave (X) ended at $3.178 on 3/6. Intermediate wave (Y) remains in progress, and while near term bounces stay below $3.178, Copper should see further downside.
Internal of Intermediate wave (W) unfolded as a zigzag Elliott Wave structure where Minor wave A of (W) ended at $3.164 on 2/21, Minor wave B of (W) ended at $3.243 on 2/23, and Minor wave C of (W) ended at $3.0955 on 3/5. A zigzag structure has a 5-3-5 subdivision and the chart is showing a nice 5 waves impulse Elliott Wave structure subdivision within Minor wave A and Minor wave C.
Intermediate wave (X) correction from $3.0955 low has a subdivision of a zigzag Elliott Wave structure. Minor wave A of (X) ended at $3.142, Minor wave B of (X) ended at $3.129, and Minor wave C of (X) ended at $3.179. Decline from $3.179 appears to be unfolding as a zigzag with first leg Minor wave A subdivided as 5 waves. Minute wave ((i)) of A ended at $3.1175, Minute wave ((ii)) of A ended at $3.1445, Minute wave ((iii)) of A ended at $3.0705, Minute wave ((iv)) of A ended at $3.087, and Minute wave ((v)) of A appears complete at 3.055. Minor wave B bounce is in progress to correct cycle from 3/6 high in 3, 7, or 11 swing. While Minor wave B bounce stays below $3.179, expect Copper to extend lower.
Copper 1 Hour Elliott Wave Chart
Source : https://elliottwave-forecast.com/commodities/elliott-wave-copper-risk-weaknesses/


