New U.S. Sanctions Hurt Russia’s Ruble and Benchmark Index
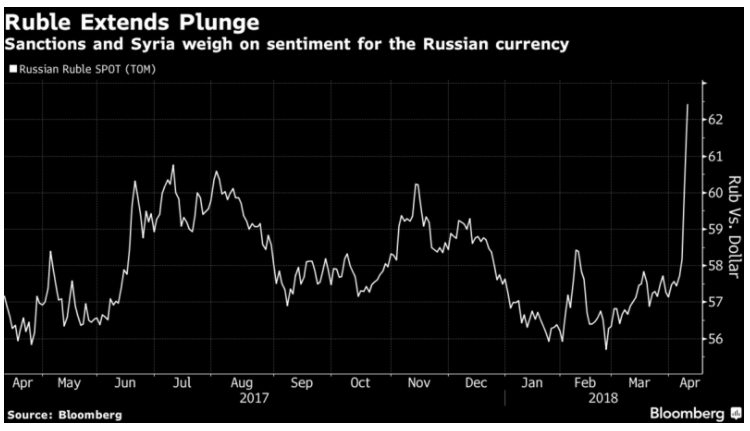
Last Friday, as part of the U.S. effort to punish Moscow for “malign activity around the globe”, the U.S Treasury Department targeted numerous Russian oligarchs, officials, and companies by freezing their assets under U.S. jurisdiction. In addition, the U.S. also prohibits U.S. citizens or entities from doing business with the sanctioned Russian entities. The Russian Ruble continues to plunge for the second day in a row by more than 4.5% after the sanctions. The Ruble’s 1 month volatility jumped 2.6% points to 11.9%, the highest among the world’s currencies after South Africa’s Rand.
The sanctions not only hurt the Ruble, but it also hurts the stock and bond markets as well. Benchmark MOEX Russia Index plunged by 8.7% on Monday following the sanction. Rusal, a Russian aluminum producer targeted by the sanctions fell by 50% in the Hong Kong stock exchange. Yields for the ruble-denominated bonds sky rocketed on the news of the new U.S. sanctions.
The new measures come amid deteriorating relationship between Russia and the West over the poisoning of Russian ex-spy Sergei Skripal In U.K last month. Mr. Sergei was killed using a military grade nerve agent that London and United States link and put the blame on Moscow. In addition, the U.S has also accused Russia of meddling in the 2016 U.S. presidential election. Then in the latest chemical attack outside Syria linked to Assad, President Donald Trump has warned of a “big price to pay” as he accused Kremlin sharing the responsibility for backing Syrian President Assad.
Ruble (USDRUB) Long Term Elliott Wave View
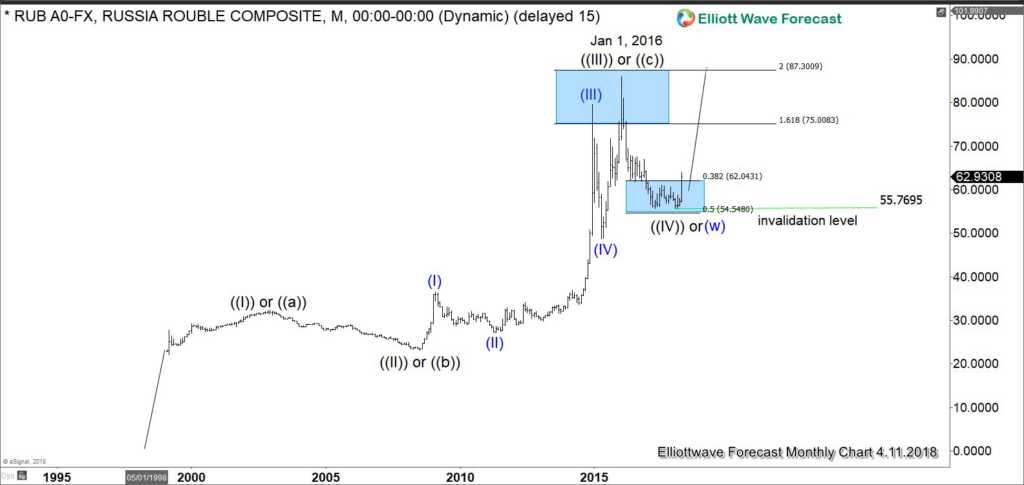
Long Term Elliott Wave view of Ruble suggests that the rally from all time low could be unfolding either as an impulse (5 waves) or a zigzag (ABC) Elliott Wave structure. The rally from Grand Super Cycle wave ((II)) to wave ((III)) has an extension compared to wave ((I)), with more than 161.8% extension, suggesting that it is possible that the move to Jan 21, 2016 high at 85.84 is only wave ((III)) and thus it should have more upside to finish wave ((V)) from all time low.
The decline to wave ((IV)) at 55.76 on Feb 26, 2018 falls between 38.2 and 50% retracement of wave ((III)). As far as USDRUB stays above 55.76, it can resume higher to new all time high in wave ((V)) or at least do larger 3 waves bounce to correct cycle from Jan 21, 2016 peak. Alternatively, the move to 85.84 on Jan 21, 2016 could be ending a zigzag ((a))-((b))-((c)) from all time low. In this scenario, the pair should be correcting the entire rally from all-time low and thus any rally should fail below Jan 21, 2016 peak (85.84) for further downside at least another leg.


