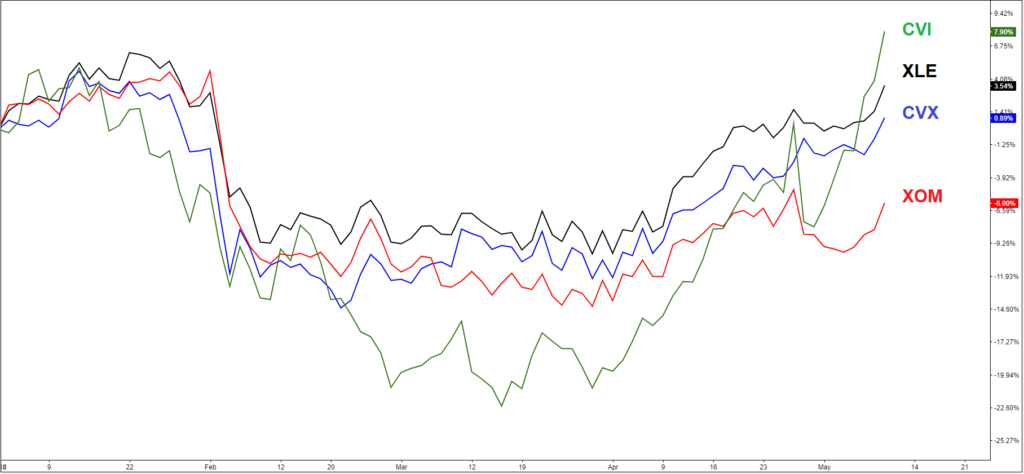
CVR Energy (NYSE: CVI) is one of the best performing Energy stocks in the recent 2 years yielding +220% since November 2016 low. Despite the correction taking place in the stock market, CVI did manage to retrace the whole decline since January peak and it’s currently already up +7.9% year-to-date.
To understand further the technical structure of the stock let take a look at the weekly Elliott Wave chart:
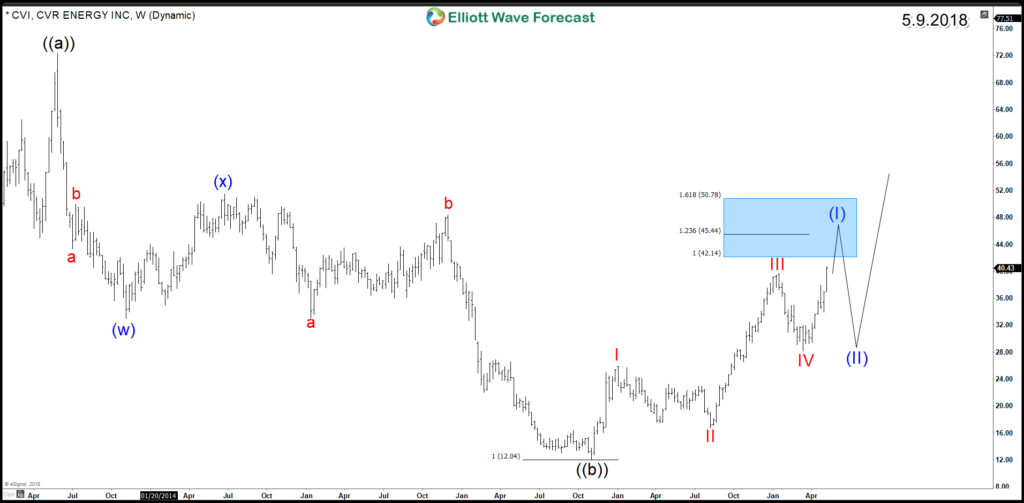
CVI Weekly Chart Scenario 1
CVR Energy ended a double three 7 swings correction in 2nd November 2016 after it reached the equal legs area $12.04. Up from there, the stock is showing an impulsive 5 waves move to the upside and looking to reach the minimum target around equal legs area $42.14 – $50.78. That technical area aligns with the 50% – 61.8% retracement of the decline from 2013 peak. Down From there, CVI can see 3 waves pullback to correct the cycle from 2016 low and then it’s expected to resume the move to the upside.
In the next chart, we’ll take a look at a second scenario for the Energy stock:
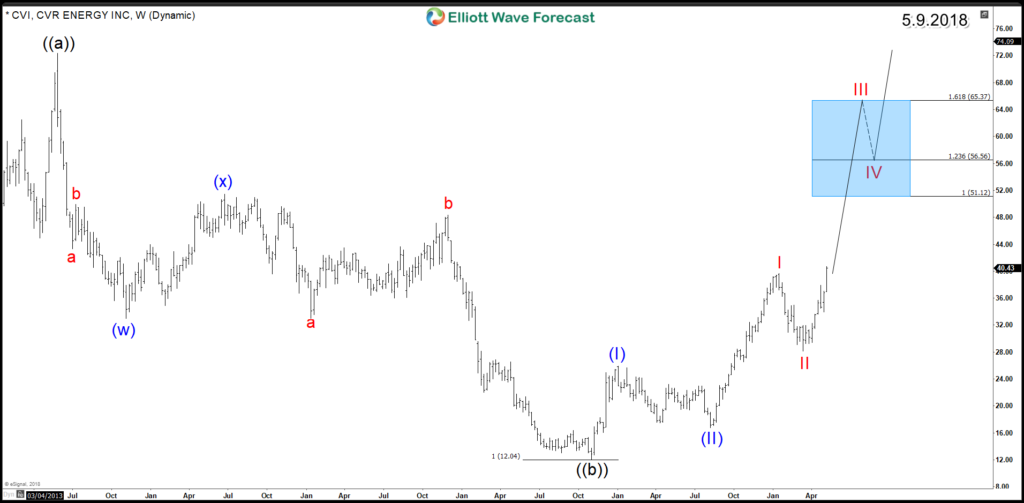
CVI Weekly Chart Scenario 2
If the current move manage to extend higher erasing the divergence from January 2018 peak, then CVI would be trading within an extended 3rd leg and will be looking to reach higher levels above $51 area before finally breaking above 2013 peak $72. For this scenario to take place, CVI needs to remain supported above March 2018 low $28 and keeps finding buyers in 3 , 7 or 11 swings.
Recap:
The bigger picture for the Energy stocks remain bullish and they are expected to remain supported for a higher move during the coming years. CVI ,which is one of the leading stocks in the sector, is showing a bullish structure from the 2016 lows which is the first step toward new all time highs.
Source : https://elliottwave-forecast.com/stock-market/cvr-energy-cvi-showing-bullish-structure/


