In this blog, we will talk about the concept of Market Timing. Market is a wild animal which always, is in full control. Many traders want to trade every day and always getting in and out of the market which ends up more like gambling than trading. We at Elliottwave-Forecast.Com have practiced the Elliott wave Theory for years and we have been guilty of many early entries into the Market following the Theory. Years ago, we started practising The One Market only concept which allow us to see the Market as a whole. The Idea allows you to be able to pick 1 or more instruments showing a clear structure within either the 3-7-11 or 5-9-13 sequences and using them as a guideline to trade the other instruments within the same group and sometimes within other groups also. In other words, we are able to use the correlation among instruments to pick the right timing to enter the trade. We have developed a system as like many others, we have fallen victim to the suggestive nature of the Elliott wave Theory. It is almost impossible to trade based in the Theory alone and it gets even more difficult when you are trading based in the Theory alone and without correlation i.e. analysing and trading instruments in isolation rather than using correlation and One Market Only concept. Our system divides the market in groups and within the groups we locate the instruments with a better structure, we locate the cycles and sequences and then identify the areas in which the market should turn, we call these areas ceilings or floors. This technique helps tremendously with the timing both as a forecaster and trader and without this technique, it’s extremely difficult to trade using the Elliott wave Theory. The difference now compared to when the Theory was developed is that now, we are able to see many instruments as compared to only a few before so why not taking advantage and use groups and correlation to get an edge in the market.
Most World Indices dipped early in the year and $IBEX entered the correction early in 2017, we knew that $IBEX was the Floor and we told members to wait for the Index to reach the Floor to gather the timing in World Indices to end their respective corrections.
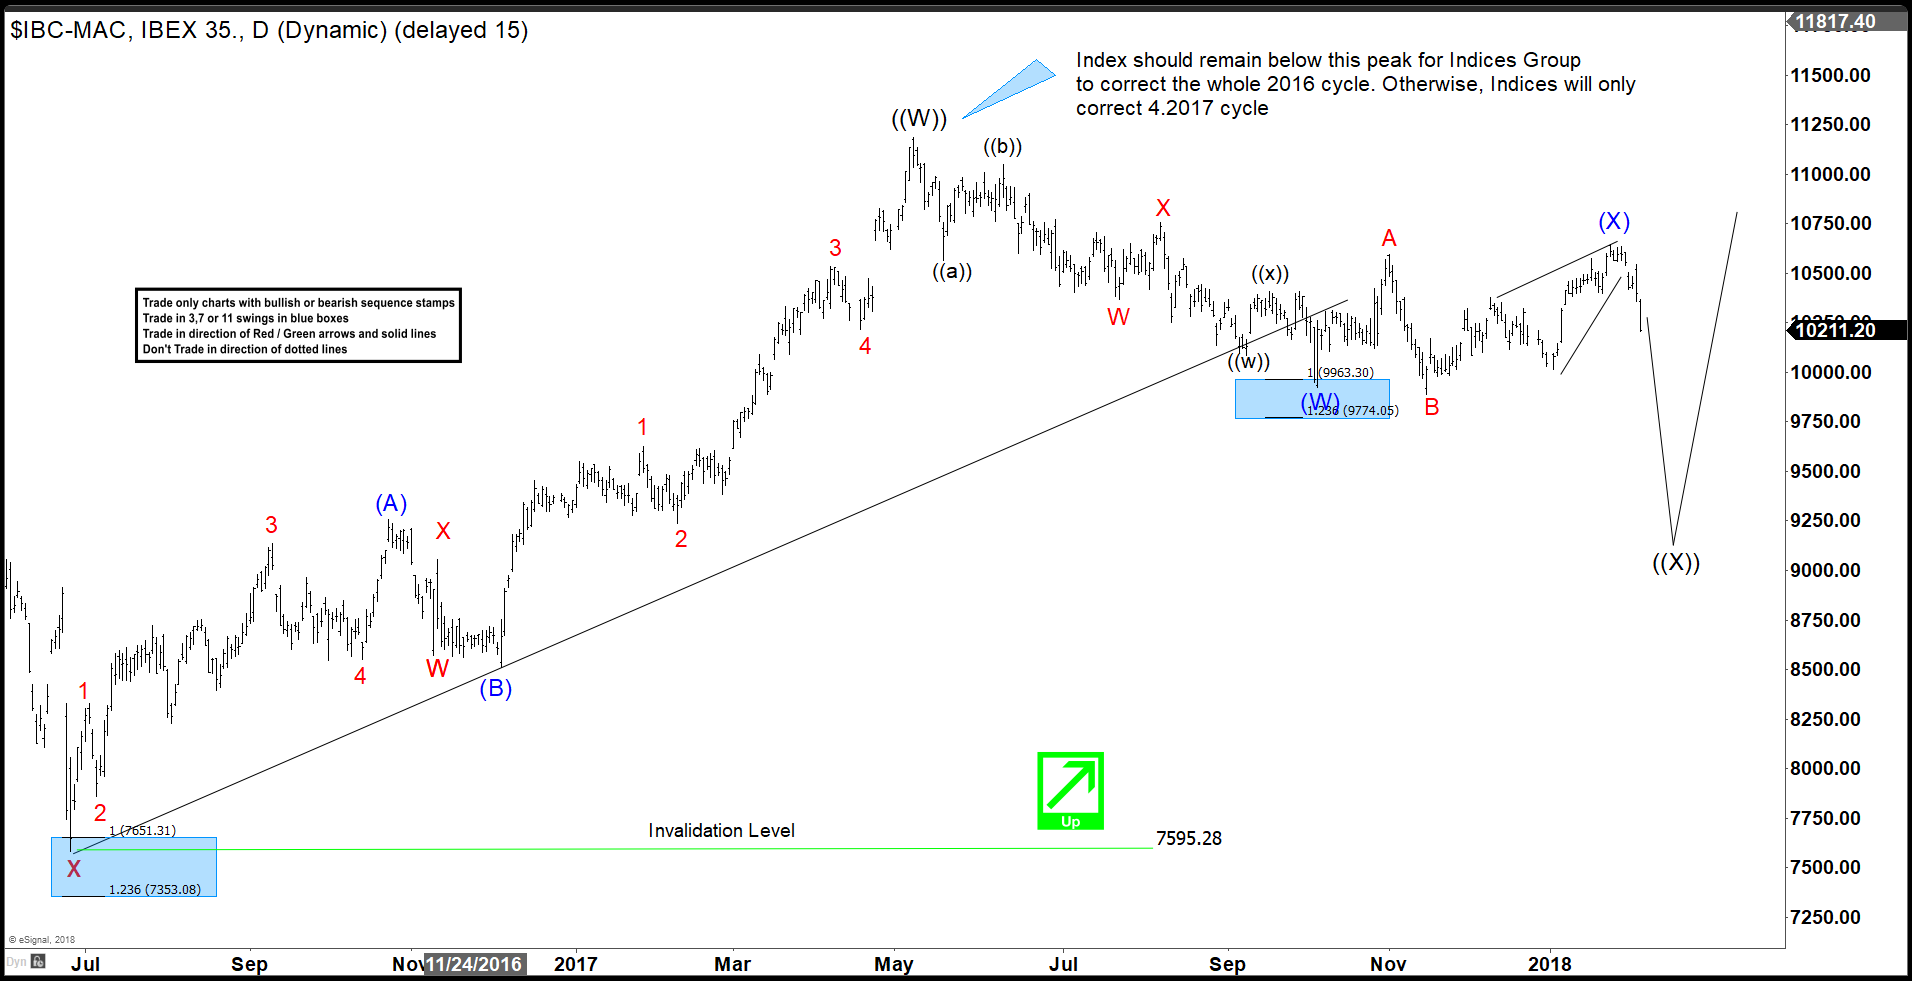
Below is the Daily chart of $IBEX at 1.2018 when the Index was doing a (X) wave, we were calling lower knowing the rest were about to peak.
IBEX Daily Elliott Wave Analysis – Market Timing – January 2018
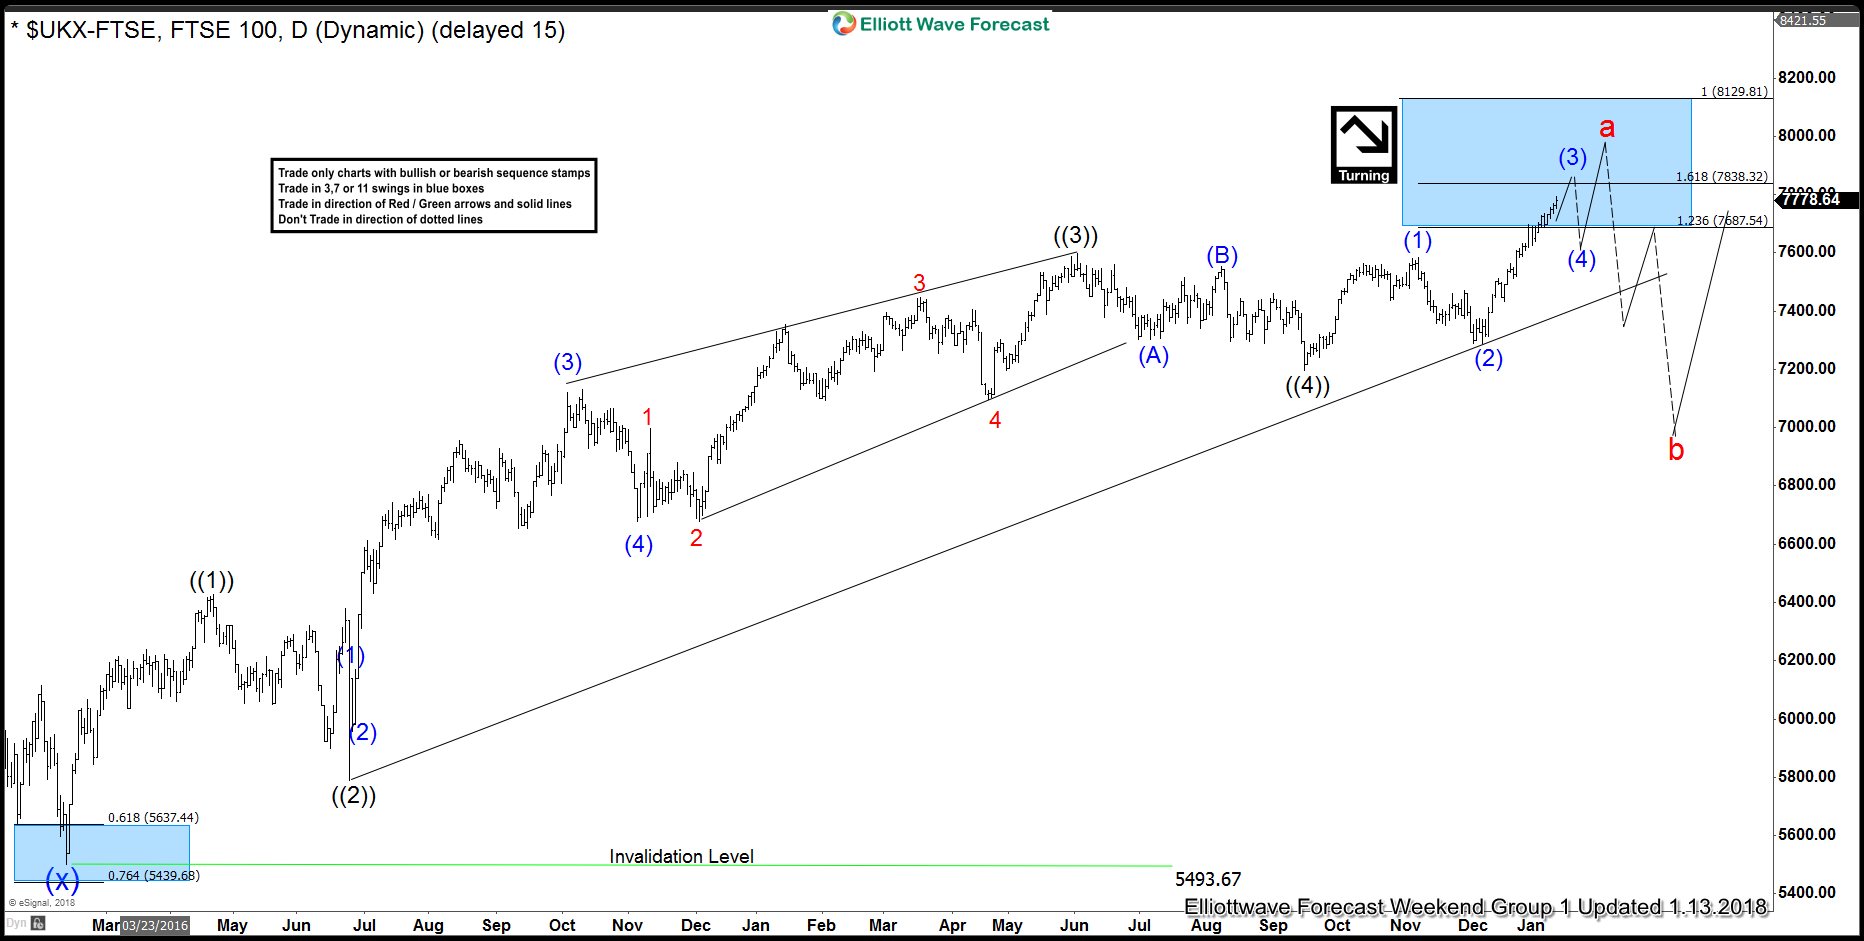
Below is the $FTSE Daily chart at 1.2018, we knew have reached the Blue Box and a dip was about to happen, it was only a matter of time.
FTSE Elliott Wave Analysis – Daily Time Frame – January 2018

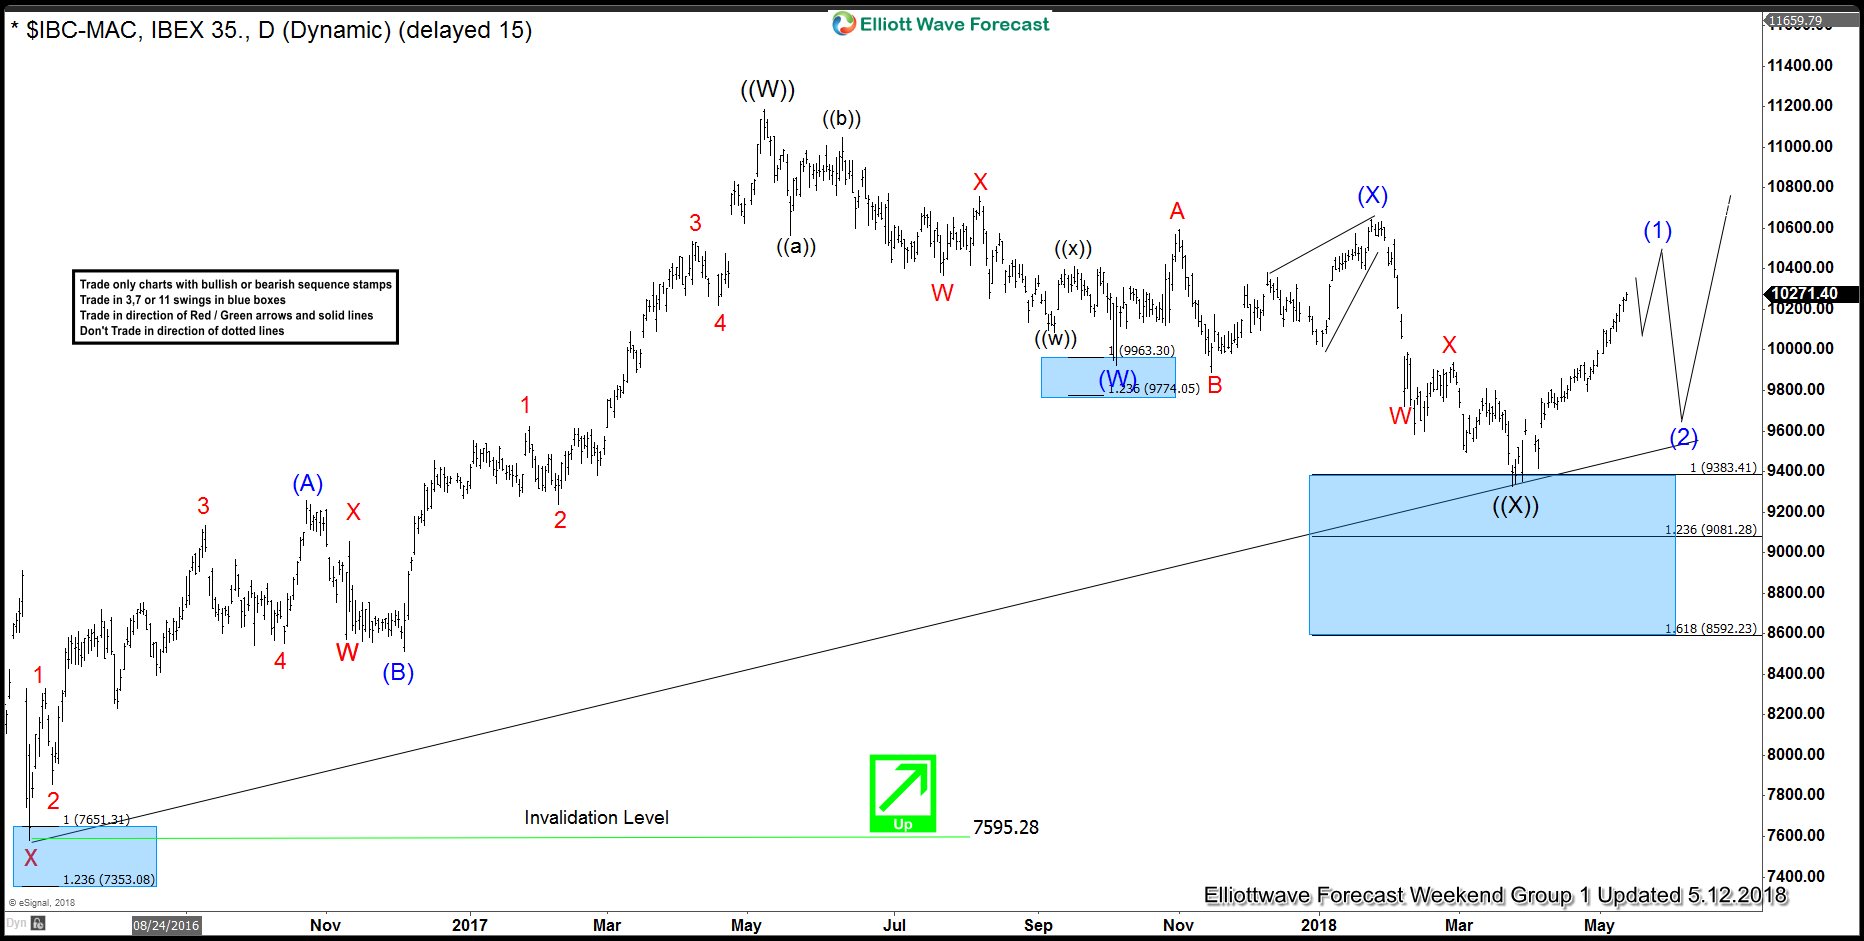
Here is the latest chart of $IBEX showing the bounce from the Blue Box after reaching the floor. Blue box represented the buying area from where we have already seen a reaction higher and any longs from the blue box should already be in a risk free position now.

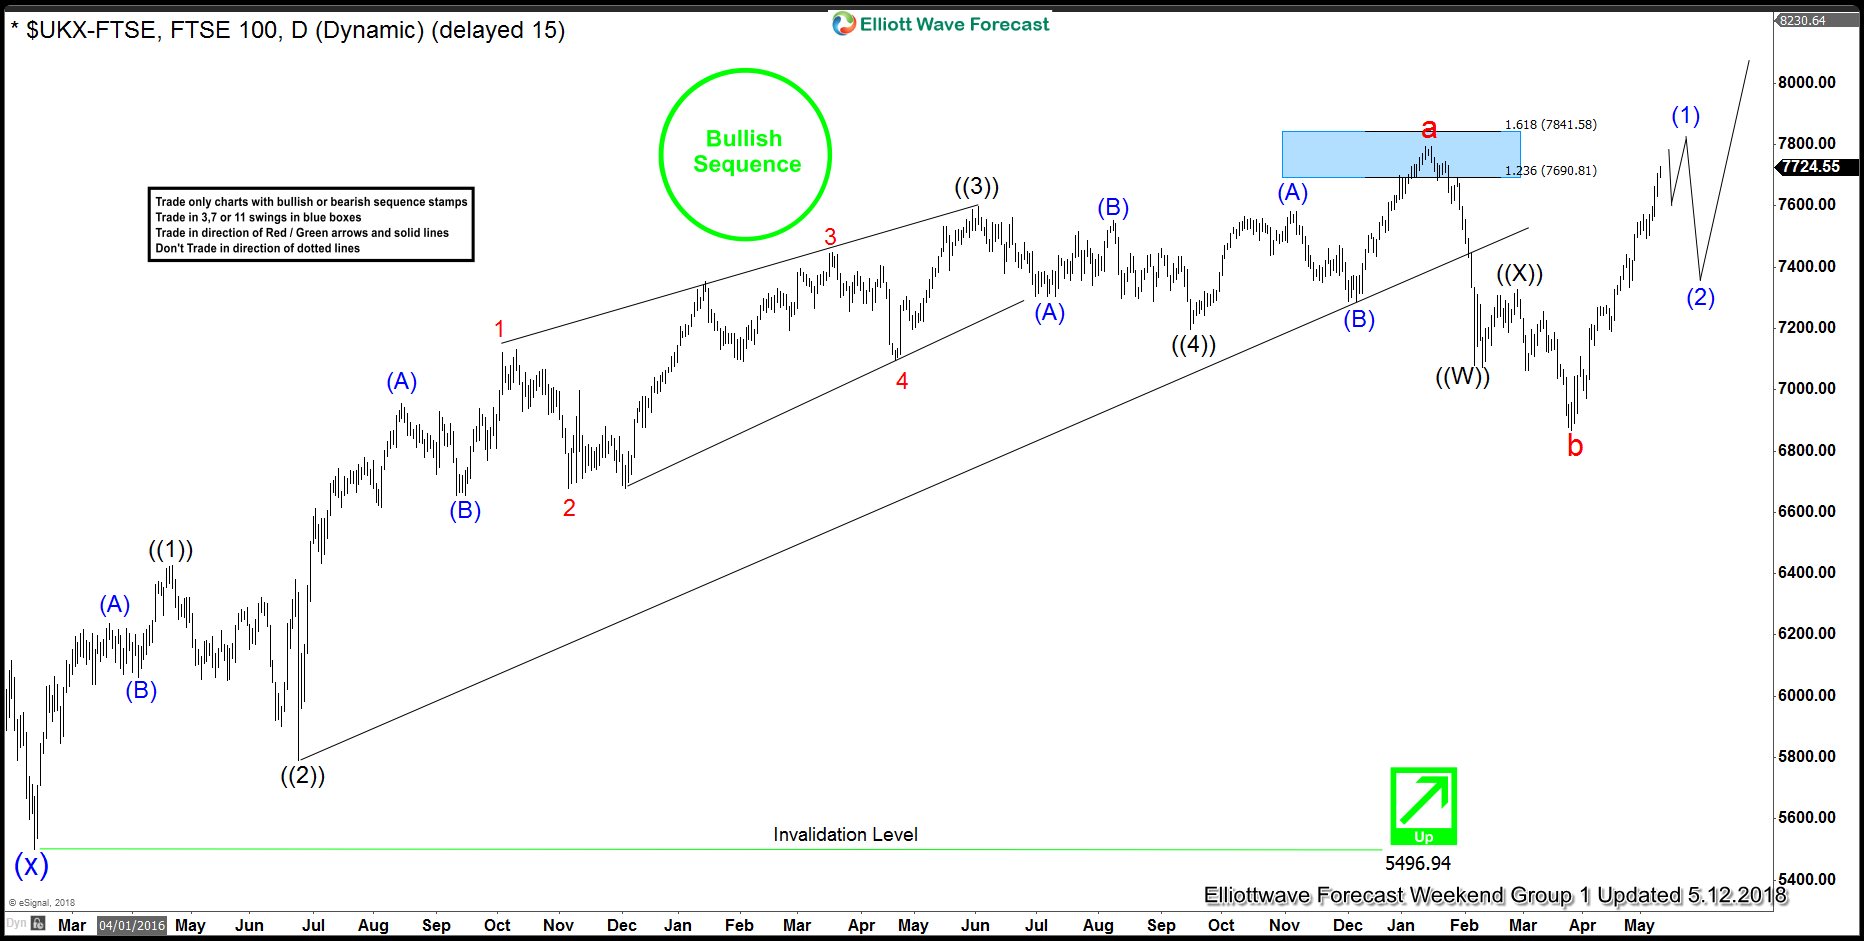
Here is the $FTSE latest Daily chart showing the reaction higher. $FTSE Index is about to break above the previous peak seen in January 2018 and a break of that peak would be the confirmation that next leg higher has started. To know the targets, check out this blog about $FTSE leading the World Indices higher.

This is a text book Market timing and understanding Market nature which without is impossible to ride the Wild Horse named Market. The Reason why Indices like $FTSE have been rallying since early February have nothing to do with Fundamentals or anything else, it is all about the Timing which in this case was $IBEX, We hope you guys understand our ideas and become a better trader understanding that nothing is perfect, but having a system help a lot and understanding the nature even more.
Source : https://elliottwave-forecast.com/trading/elliott-wave-theory-market-timing/

