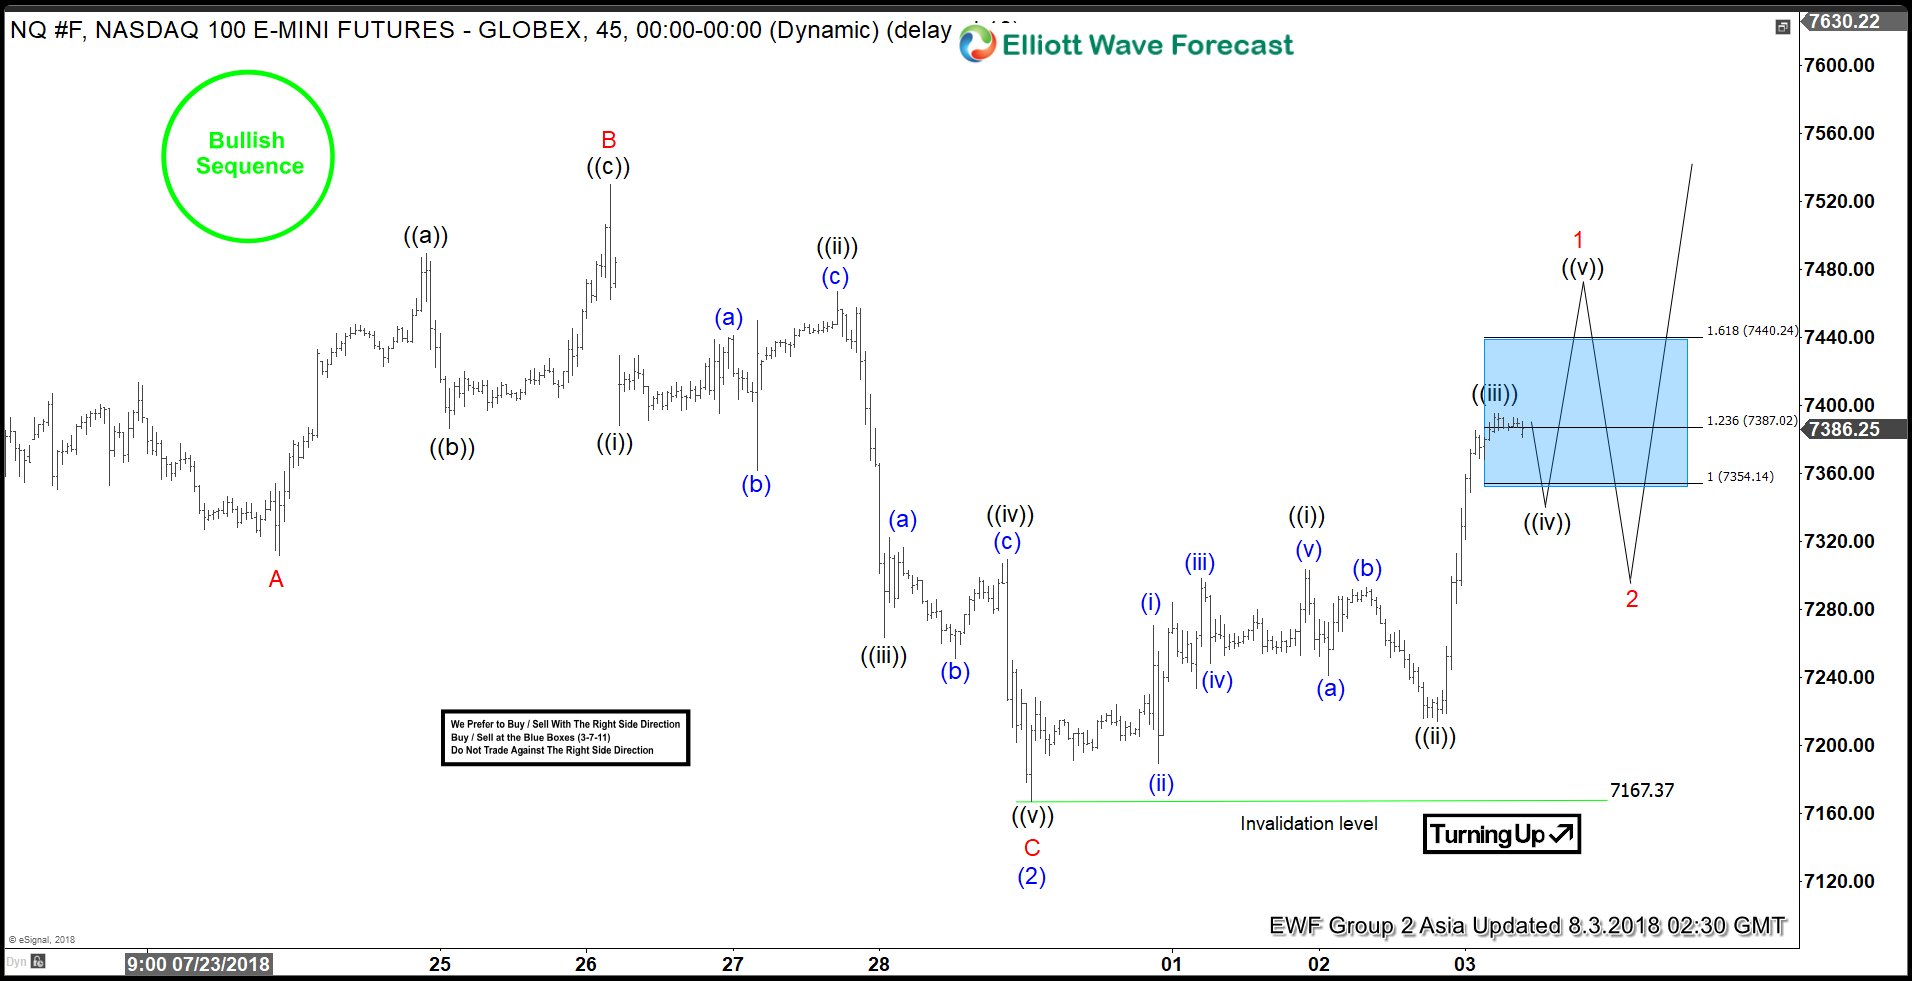
NASDAQ futures: ticker symbol NQ_F short-term Elliott wave analysis suggests that the decline to $7167.37 low ended intermediate wave (2) pullback. The internals of that pullback unfolded as Elliott Wave Flat correction where Minor wave A ended at $7311.50 low. Above from there, the bounce to $7530 high ended Minor wave B bounce as Elliott wave Zigzag where Minute wave ((a)) ended at $7489.75 high, Minute wave ((b)) pullback ended at $7386.75 low and Minute wave ((c)) of B ended at $7530 high.
Down from there, the index declined in 5 waves lower within Minor wave C. The first leg lower Minute wave ((i)) ended at $7388.5. Up from there, the bounce to $7467 high ended Minute wave ((ii)) and then the decline to $7263.50 low ended Minute wave ((iii)). Minute wave ((iv)) bounce ended at $7309.25 and the last leg Minute wave ((v)) of C ended at $7167.37 low. This last leg also completed Intermediate wave (2) pullback. Near-term, while dips remain above $7167.37 low, expect the Index to do a nesting to resume the the next leg higher. A break above $7530 (irregular wave B) however is needed for final confirmation to avoid a double correction lower. We don’t like selling the index.


