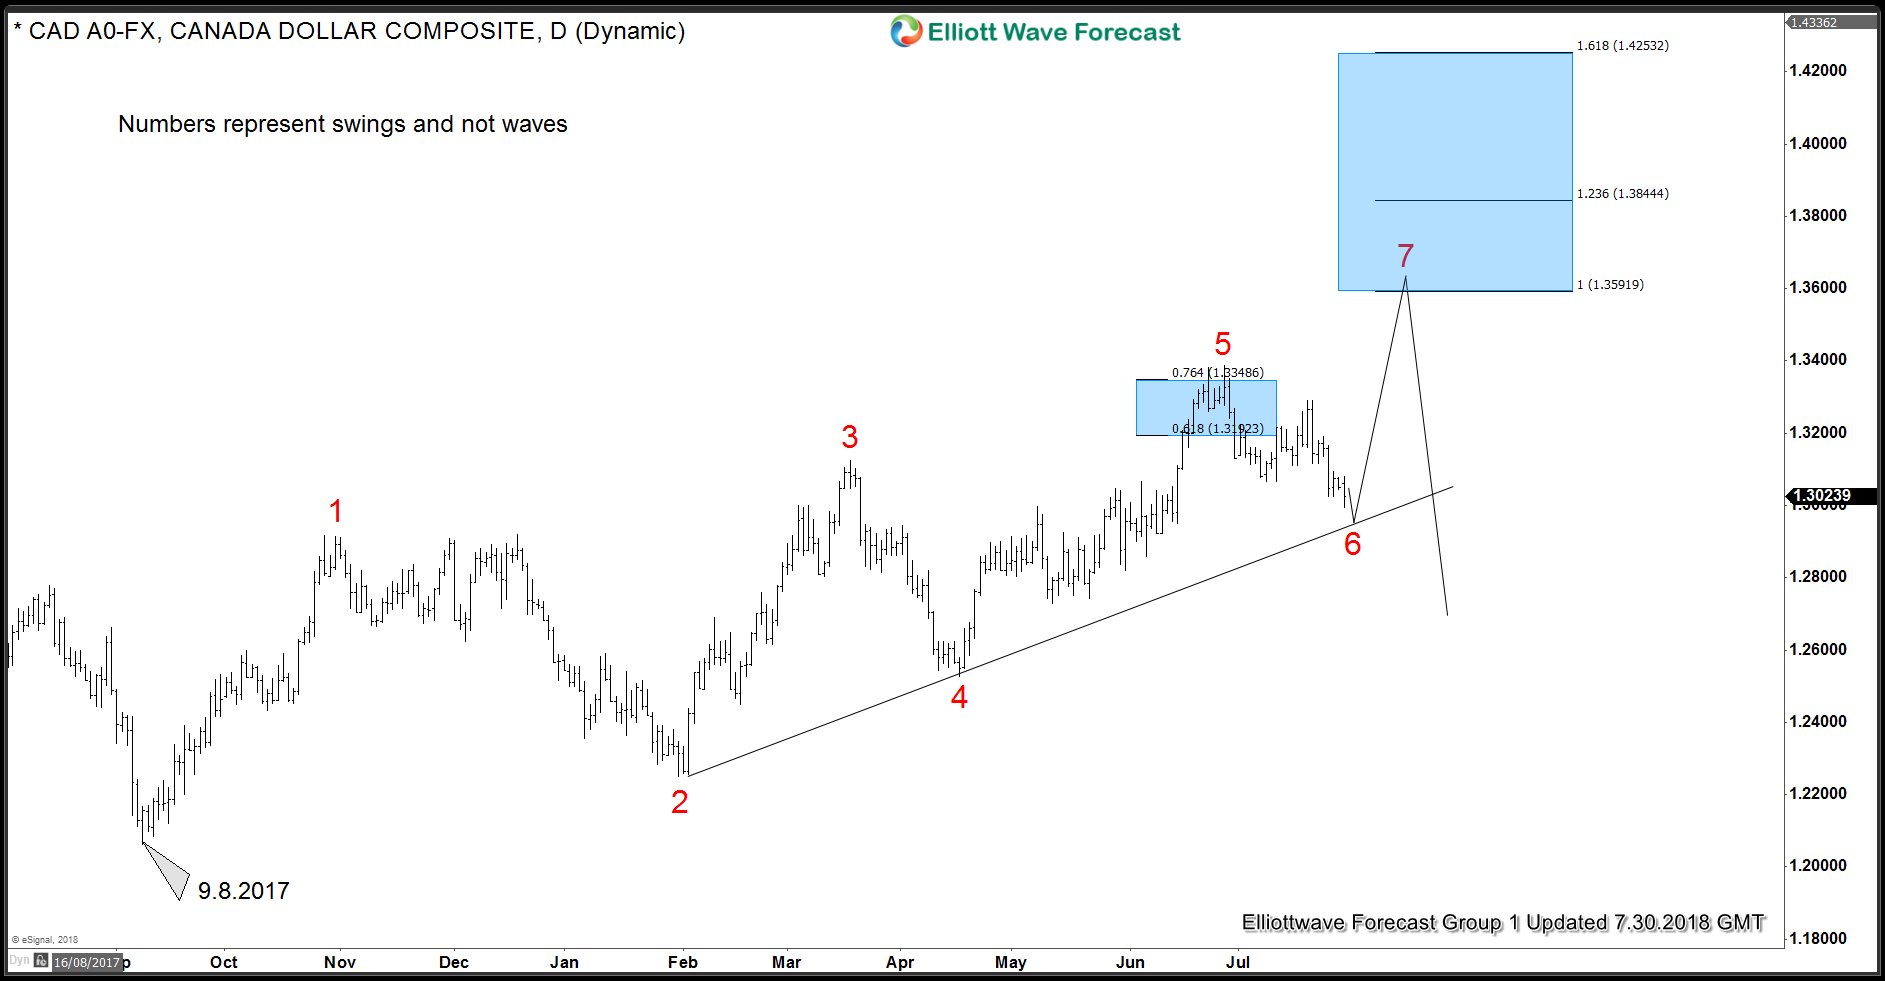
USDCAD Elliott Wave Analysis and swing analysis suggests pair is showing 5 swings up from 9.8.2017 low. Impulsive sequence runs in 5, 9, 13, 17 and so on whereas corrective sequence runs in 3,7,11,15 and so on. Daily chart below shows the move up from 9.8.2017 low is overlapping and hence it’s corrective in natures and not impulsive. This means 5 swings is an incomplete sequence and pair is need of 7th swing to complete a 7 swings sequence up from 9.8.2017 low.
USDCAD Elliott Wave Analysis – Daily Swings Sequence
Chart below shows the swings sequence up from 9.8.2017 low where rally to 1.2916 (10.27.2017) completed swing 1, drop to 1.2250 (1.31.2018) completed swing 2, rally to 1.3124 (3.19.2018) completed swing 3, pull back to 1.2527 (4.17.2018) completed swing 4 and rally to 1.3386 (6.27.2018) completed swing 5, current pull back should complete swing 6 and should ideally stay above the trend line which connects swings 2 and 4 on a closing basis. The trend line is currently at 1.2949. After 6th swing is complete, we expect the pair to rally towards 1.3591 – 1.3844 area (100 -123.6 extension area of the first 3 swings) to complete a 7 swings sequence from 9.8.2017 low.
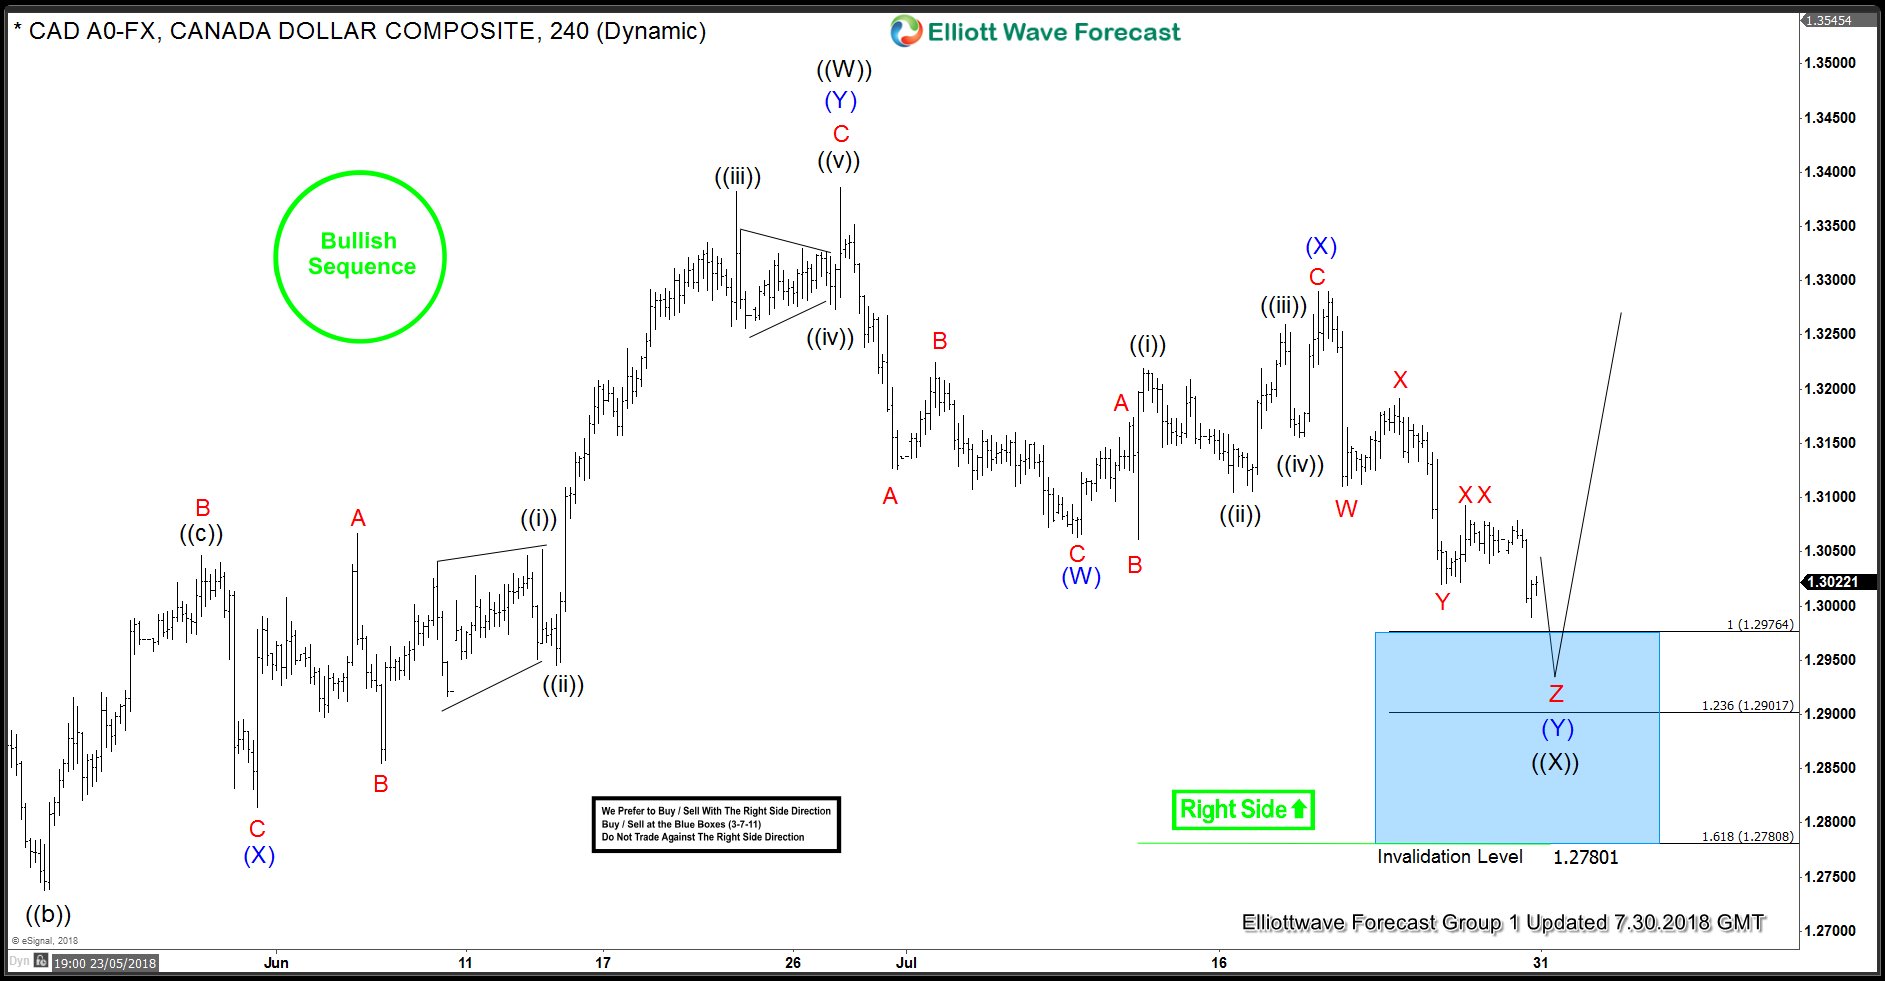
USDCAD 4 Hour Elliott Wave Analysis
USDCAD Elliott Wave Analysis in 4 hour time frame shows the structure of the 6th swing. It is proposed to be unfolding as a double three Elliott wave structure and expected to complete soon. Chart below shows a right side green up arrow which indicates the right side in this time frame is to the upside and thus, we would only be looking for buying opportunities in this time frame in the sequences of 3, 7 or 11 swings. In this case, correction has taken the form of 7 swings and blue box (1.2976 – 1.2780) represents the inflection area where correction is expected to complete and rally is expected to resume for new highs or produce a 3 waves bounce at least to allow buyers to create a risk free position.


