In this blog I want use the stock of AT&T (NYSE:T) to show you an outstanding example of our typical low risk trade setups using our Blue Box System. In our recent Group 3 Member Area updates we stated T to be Bearish on both the Daily and 4-Hour time frames. This cohesive directional call between the two time frames gave us confidence to look for near term trade setups to the downside.
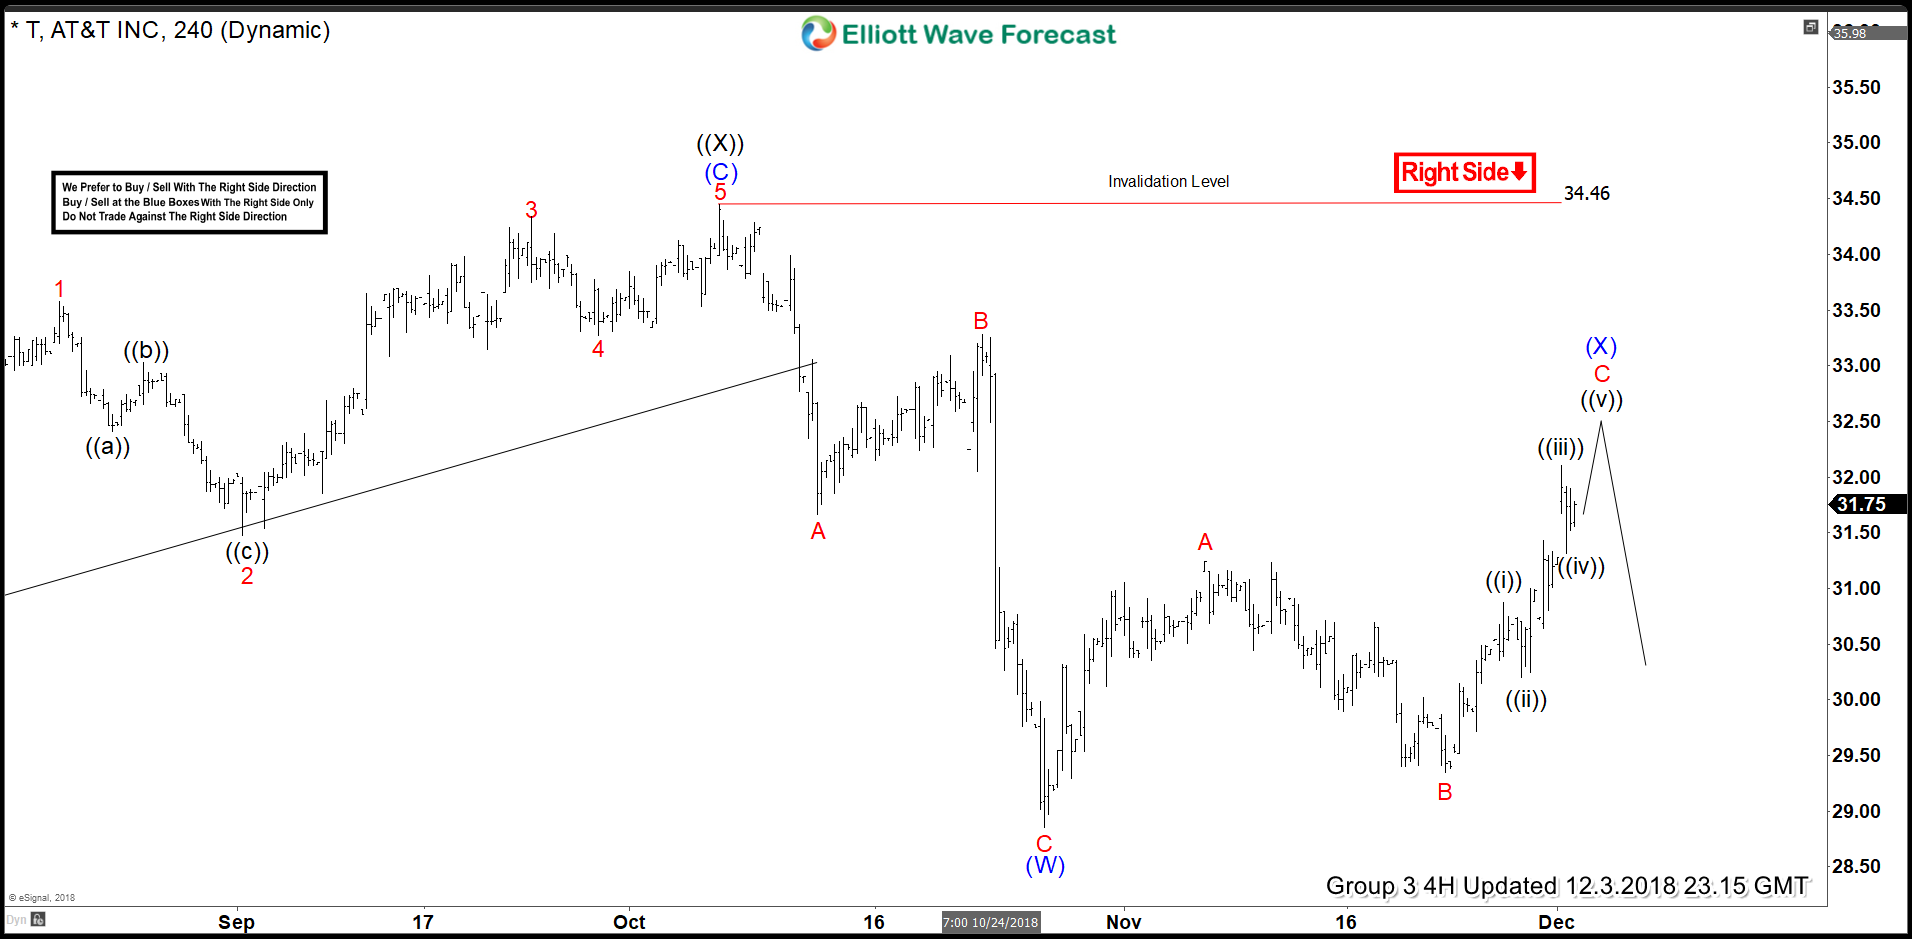
4 Hour Chart of T with the Subwaves of the (X)

T completed a cycle at the 28.85 low in Intermediate degree wave (W) in blue on 10/26/2018. This completed the nearest cycle lower from the 10/5/2018 peak and would allow us now to look for our typical bearish setup. Members were communicated confirmation of a bearish sequence. So, in the next few sessions we set the short trade up against the prior cycle peak of 10/5/2018 at 34.45. You will hear references to 3,7, or 11 swings a lot at Elliottwave-Forecast. This 3, 7, or 11 swing count and its related measured area is where a reaction should occur. 85% of the time the reaction is a return to the direction of the sequence. In the case of T to the downside. In the chart above you can see the anticipation area where the 3rd swing higher should end.
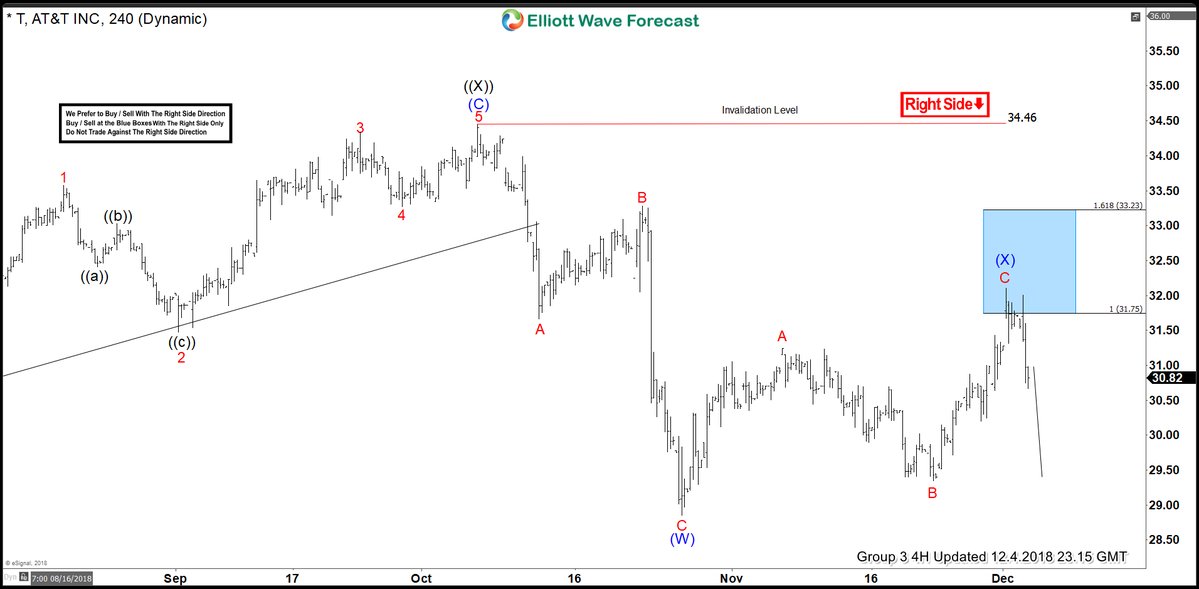
4 Hour Chart Highlighting the Blue Box Reaction Zone in T

Now that we had charted and confirmed the first and second swings of the proposed 3 swing move higher in T we could get a range to initiate shorts. The blue Box Range was calculated by taking Fibonacci extensions of the length of Minor degree wave A (in red) from the bottom of Minor degree wave B (in red). This projected target range for Minor degree wave C and Intermediate degree wave (X) (in blue) was 31.75-33.23. So entry for the trade was 31.75 with a stop above the 1.618 extension at the top of the blue box at 33.30. This is well under our 34.45 invalidation level. This level had to remain unbroken in order to have continued with the bearish sequence.
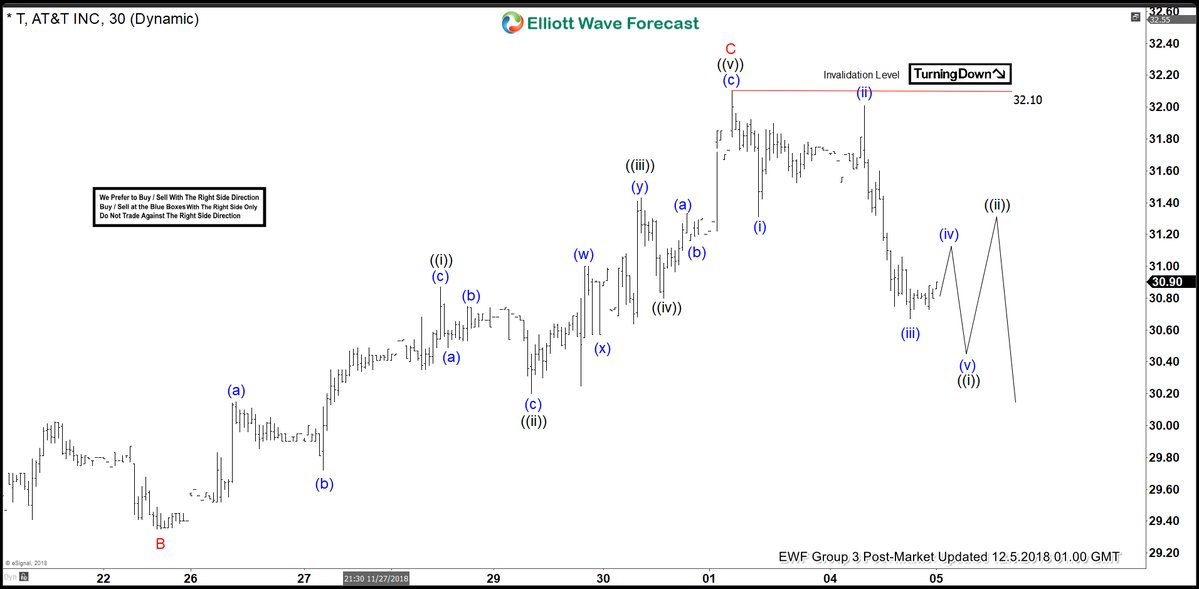
30 MIN Chart Highlighting the Reaction from the High

On 12/3/2018 T hit a high of 32.10 in the target area and reacted lower. The reaction was intense enough so that now our Group 3 T traders can take all risk off the trade. Prices should now not go above the 32.10 high before completing a cycle lower below 28.85. Our Group 3 Members have the targets we seek on the downside. This was a perfect example of using our sequence and cycle analysis to formulate a high probability low risk trade setup. We do these similar setups in all 78 instruments we cover. As a subscriber of all three groups you can cherry pick the very best setups to increase your odds in the world of trading every day.
Trade Safe,
James
EWF Analytical Team

