CVR Energy (NYSE:CVI) is presenting one of the best technical structure in Energy market despite the recent scary 40% drop in Oil prices.
At Elliottwave Forecast, we believe in the One Market Concept, therefore, we always look for answers around other instruments within the market. Since 2016 low, CVI did advance in a bullish 5 waves impulsive structure correcting 50% of the decline from 2013 peak.
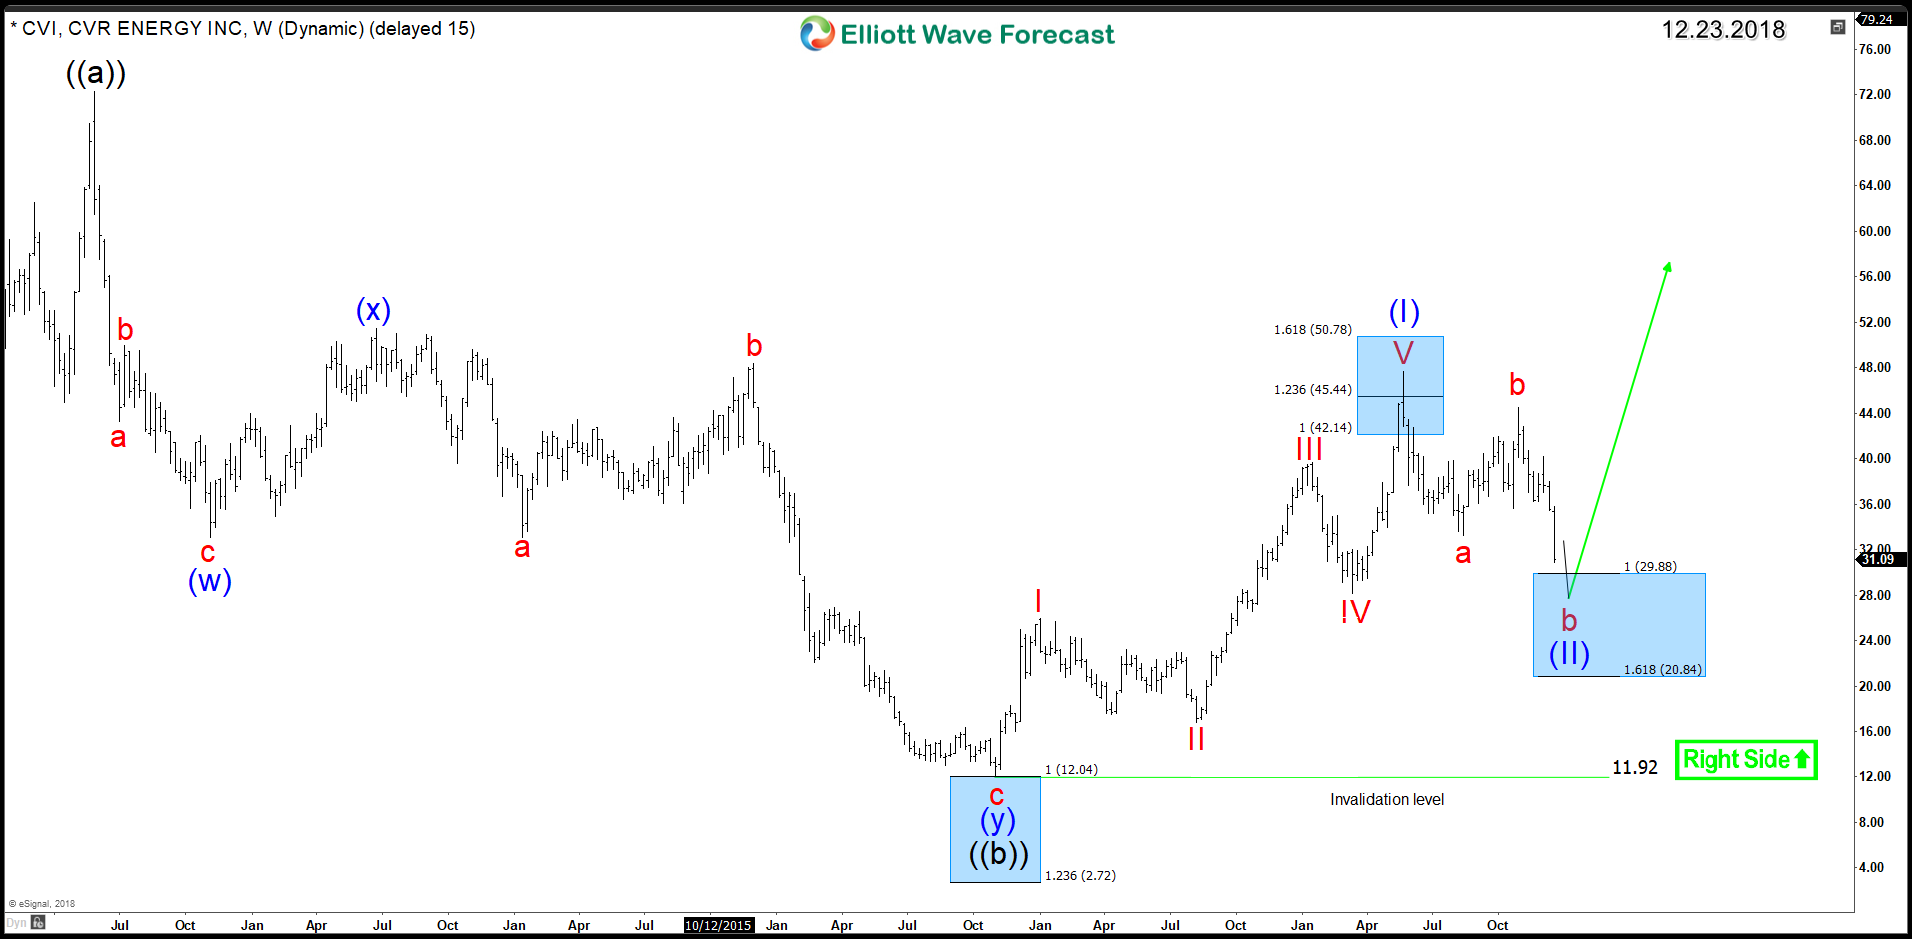
The most aggressive bullish view suggest that CVI started a new Grand supercycle in 2016 and the rally was only a first wave of 5 waves move. Consequently, the current 3 waves pullback will find buyers at the 100% – 161.8% Fibonacci extension area $29.8 – $20.84 to finish a wave (II). Up from there, CVR Energy will resume the rally higher looking for a strong 3rd & 5th waves higher and ideally a break above 2013 peak for a target at $82 – $98 area. In the other hand, CVI rally could end up being just a wave (c) of a zigzag structure. So it can fail below $72 peak followed by another correction lower.
CVI Weekly Chart 12.23.2018

The presented blue box in the above chart is a High-frequency area where the Market is likely to end cycle and make a at least a 3 waves bounce to allow investors to create a risk free position. Then until the stock break above May 2018 peak, it can still do a 7 or 11 swings correction lower before ending wave (II) or (b).
Conclusion:
CVR Energy current corrective correction is presenting a new investing opportunity similar to the one that took place in 2016 from the weekly blue box area $12.04. Consequently, energy stocks will be looking for a recovery to take place in 2019 which can lead to another 2 years rally.

