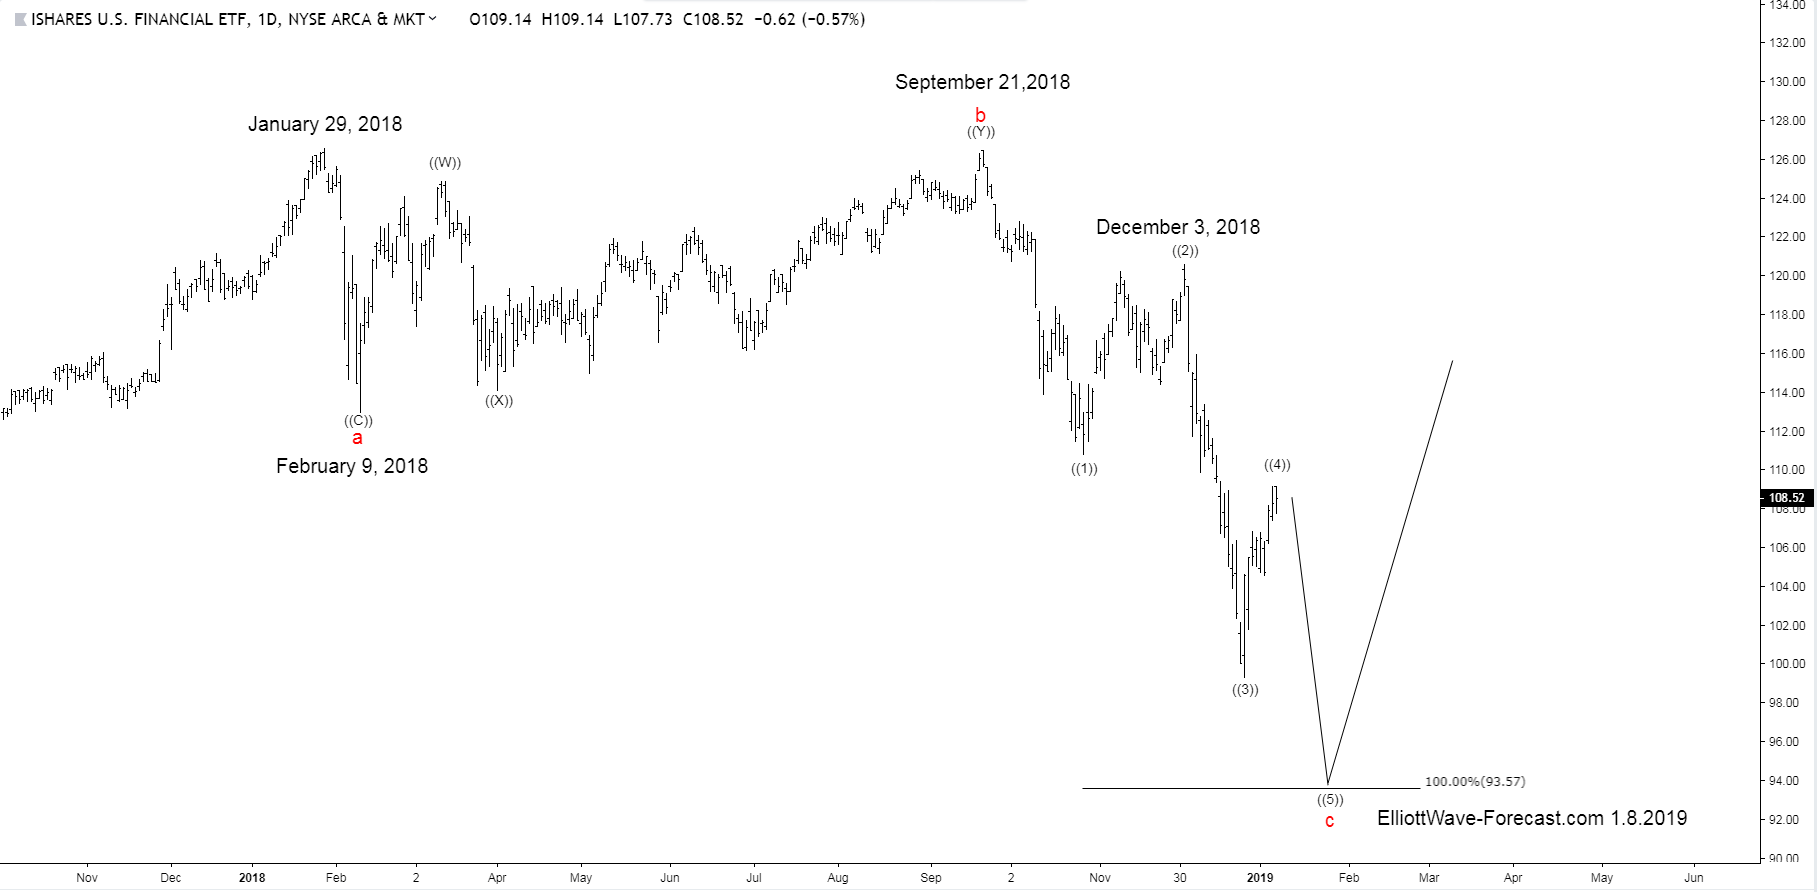
IYF Flat from the January 29, 2018 highs
The iShares US Financials ETF, symbol IYF appears to be a flat correction lower from the January 29, 2018 highs. It has been persistent and strong enough to suggest it is correcting the bullish cycle up from the February 11, 2016 lows. At this point in time the Elliott Wave structure remains incomplete and it is still missing one more swing low.
Firstly I will elaborate about what a flat wave structure should look like. Flat structures subdivide into three larger swings with the whole structure in what is called a 3-3-5. Basically the first two swings will subdivide into a three wave move with the final wave subdividing into five waves. Those five waves may or not be overlapping as in a diagonal impulse wave however it should still end by giving five clear swings. The fifth wave usually will end with some momentum indicator divergence when comparing the fifth wave with the third wave.
The analysis continues below the chart.
IYF Daily Chart

Secondly I would like to mention what will keep the flat structure analysis as remaining valid. The current wave four is already a bit higher than I would typically like to see. I am referring to the Fibonacci retracement. It has seen the 109.14 area today which is a little past the .382 Fibonacci retracement which is a typical area. The wave four bounce of course is correcting the cycle from the December 3rd, 2018 highs. During the wave four bounce, the momentum indicators should continue to give a weaker reading when compared to the wave two highs.
In conclusion. The target area line on the chart is where the wave five would equal the wave one if the wave four ended at 109.14. It is very possible the wave four overlaps the wave lows of wave one before turning lower again. In case that happens the target area for the fifth wave will be above what is shown there at 93.57. Either way the flat structure should see another low before the instrument turns higher.
Kind regards & good luck trading.
Lewis Jones of the ElliottWave-Forecast Team

