
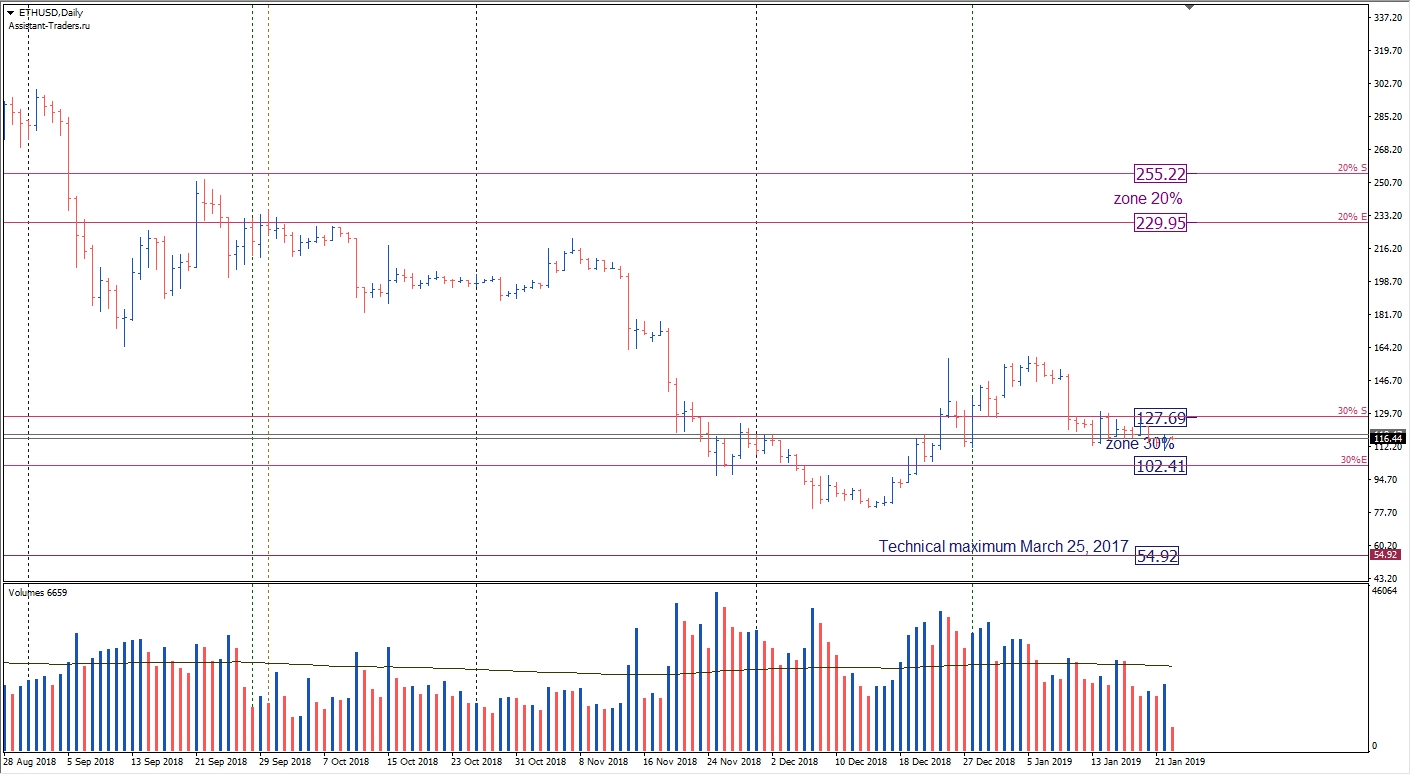
The nearest long-term area of resistance is the 20% sellers area (229.95-255.22).
The nearest long-term area of support is 30% of sellers (127.69-102.41).The next support level on the daily timeframe is the technical minimum of March 25, 2017 (54.92).
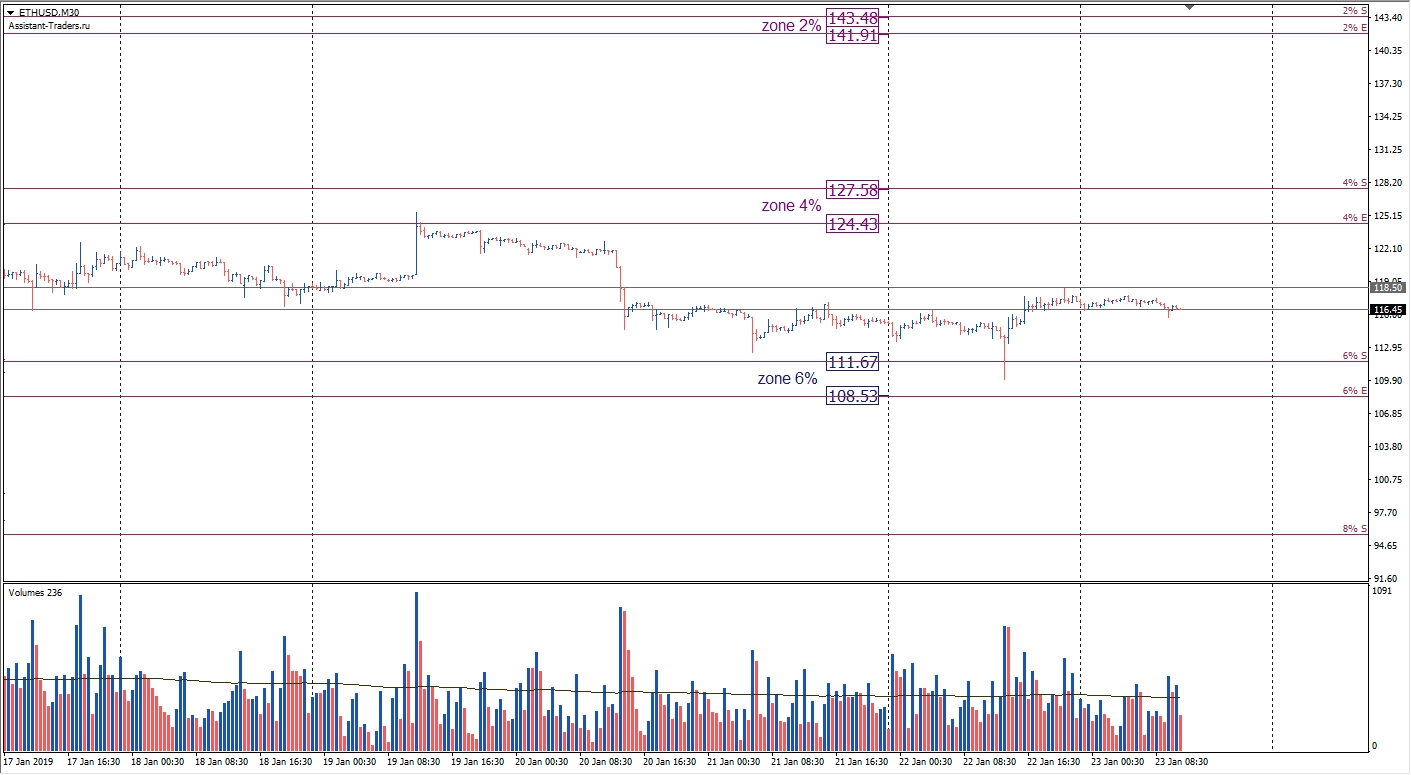
The immediate goal of reducing the current working week and the key area of support today is the medium-term zone of 6% of sellers (111.67-108.53).
The nearest area of resistance for the current working day is the zone of 4% of sellers (127.58-124.43).
The next area of resistance is the zone of 2% of sellers (143.48-141.91).
A detailed analytical review of the major currency pairs of the Forex market, Bitcoin and Ethereum cryptocurrencies, WTI crude oil, gold index, and S&P500 stock index is further on YouTube channel.
Dmitry Zeland, analyst at a brokerage company MTrading.