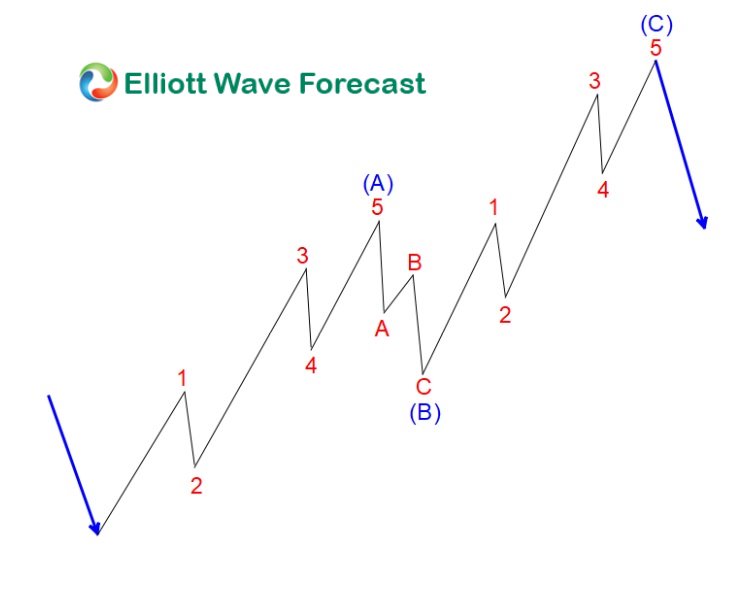
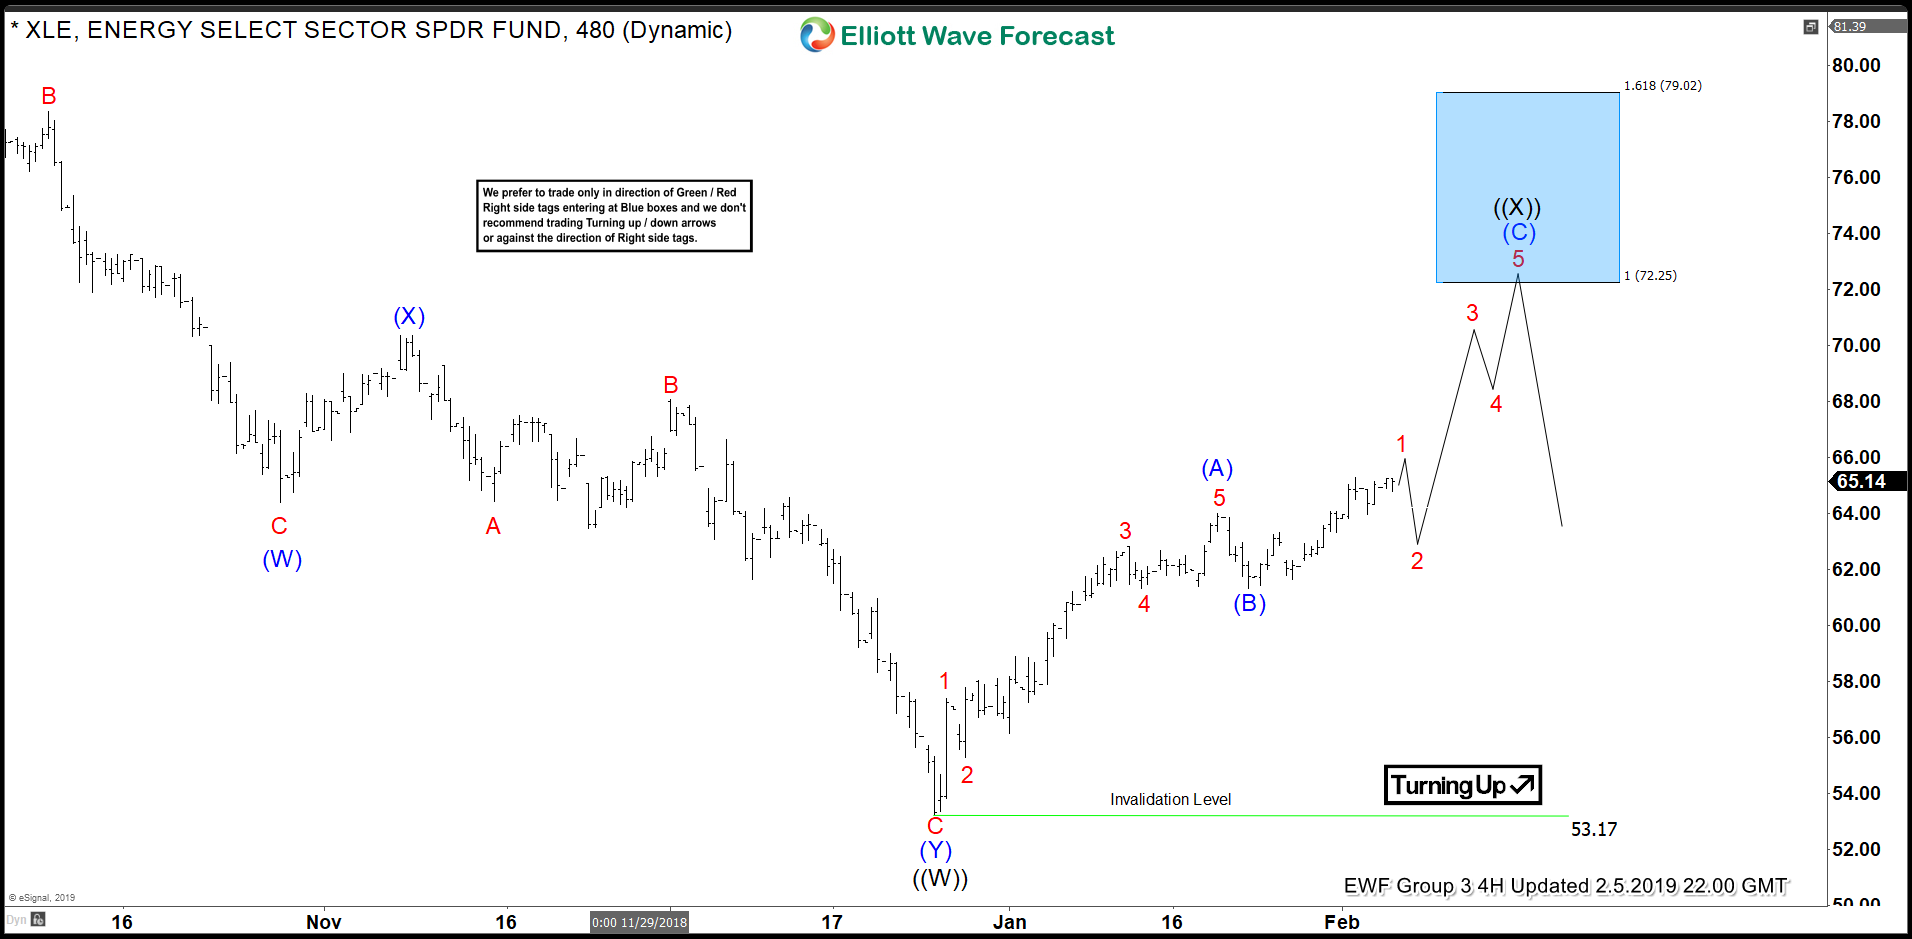
The Energy Sector ETF, XLE, remains bullish in the near term. From the lows of $53.25 on 12/24/2018 we are charting a zigzag Elliott wave pattern. The target to the upside is $72.25 while the $61.30 low of 1/23/2019 holds.
The Model of the Elliott Wave Pattern

ZigZag patterns always subdivide into three waves. In the chart above these waves are labeled (A) – (B) – (C). Waves (A) and (C) always subdivide or downgrade into an impulsive 5 wave structure or a motive diagonal structure. Wave (B) can subdivide into any corrective structure, but must never move beyond the origin of the entire structure. Or, in other words, wave (B) cannot go below the start of the (A) wave in the chart above.
It is common to see the length of wave (A) in a zigzag equal to the length of wave (C). We call this relationsip a measured move or equal legs. Moreover we are using this common property of the zigzag structure to project a near term high in XLE.
Current 4Hr Chart of XLE

Using the same guidelines for the typical zigzag model we are now projecting an end to the current rally in XLE. With a typical relationship between waves (A) and (C) to be equal a trader can target a near term top in XLE at $72.25. The critical factor for this analysis to hold is prices remaining above the (B) wave low. So, while above $61.30 we’re looking for 5 subdivisions in (C) to the upside to reach our target.
To Your Success!
James
EWF Analytical Team
