Silver has been bouncing since making a marginal new low on April 4, 2019. We publish a free Chart Of The Day from visitors of our websites every day from Monday – Friday. We showed Silver 1 Hour Elliott wave count in 3.29.2019 Chart Of The Day and forecast was for another low to complete 5 waves decline from $15.63 peak followed by a bounce and lower again. Below chart is from 3.29.2019 that we presented as Chart Of The Day.
Silver 1 Hour Elliott Wave Count – 3.29.2019
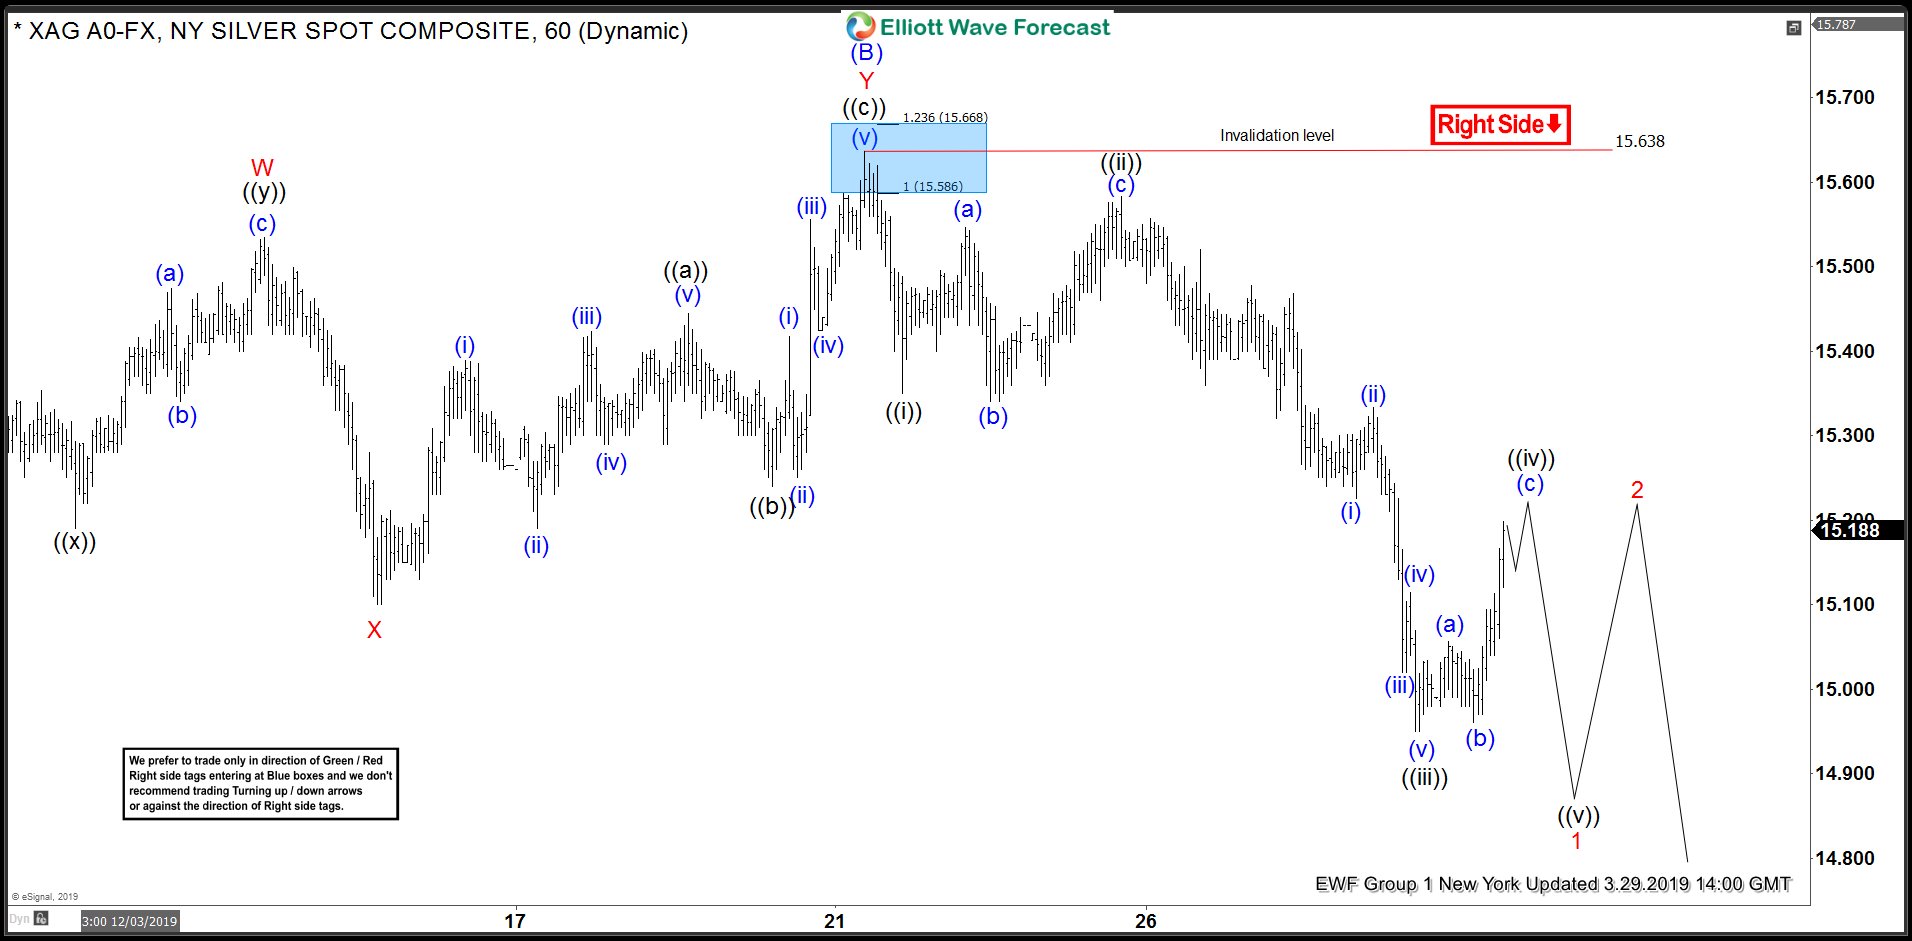
Wave ((iv)) bounce failed as expected and it resulted in a new low to $14.88 on April 4, 2019. This low was below wave ((iii)) low $14.95 and hence it met the minimum requirements for a 5 waves decline from $15.63 peak. According to Elliott Wave Theory, after a 5 waves impulsive decline, a 3 waves correction should take place. Now, let’s take a look at the latest 1 Hour chart of Silver from the members area.
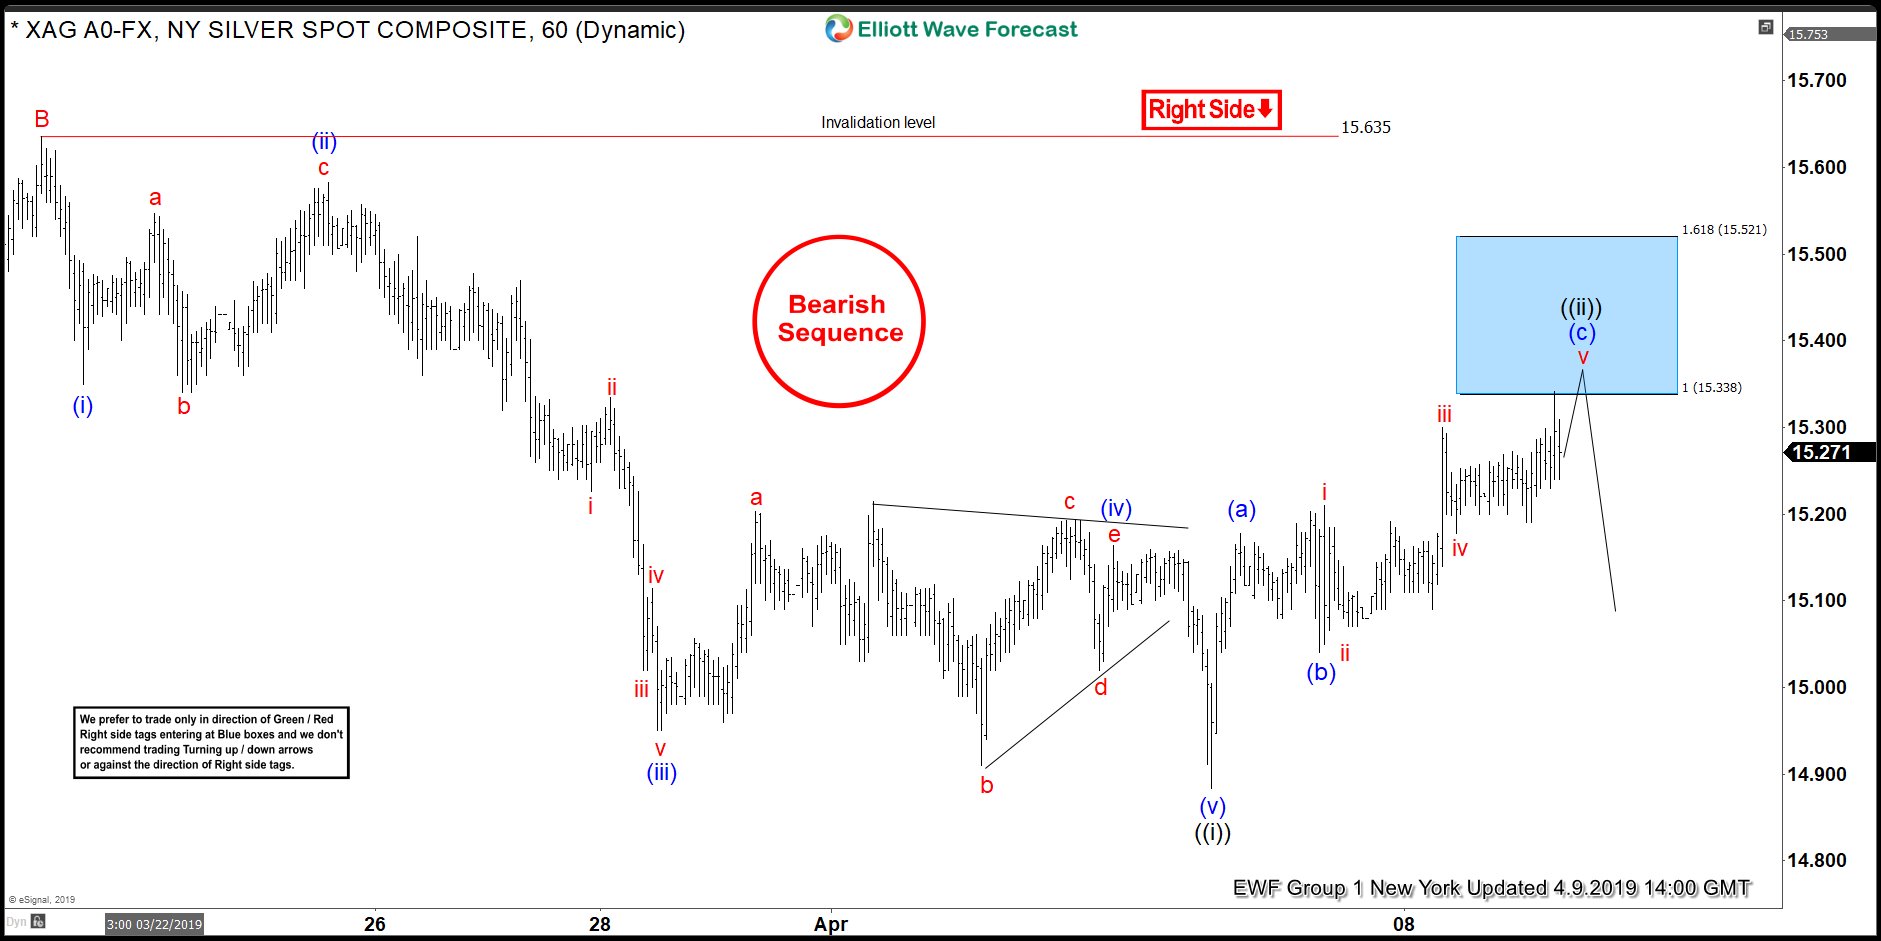
Silver 1 Hour Elliott Wave Count – 4.9.2019
Chart below shows the expected 3 waves corrective bounce is taken the form of a Zigzag Elliott wave structure. A zigzag is a 5-3-5 structure labelled ABC, both waves A and C are 5 waves (impulse or diagonal) and wave B could be any corrective structure. In the current wave ((ii)) bounce, wave (a) ended at $15.17, wave (b) ended at $15.04 and wave (c) has entered the blue box reaching the minimum target at $15.33. It can still make another high within the blue box but should ideally hold below $15.52 and then resume the decline in wave ((iii)) or make a larger 3 waves pull back at least to correct the cycle from $14.88 low. Invalidation level for this Elliott wave count is at $15.63 and as far as that level is holding, expect Silver to resume the decline in wave ((iii)) of C.