XLE Topping Soon
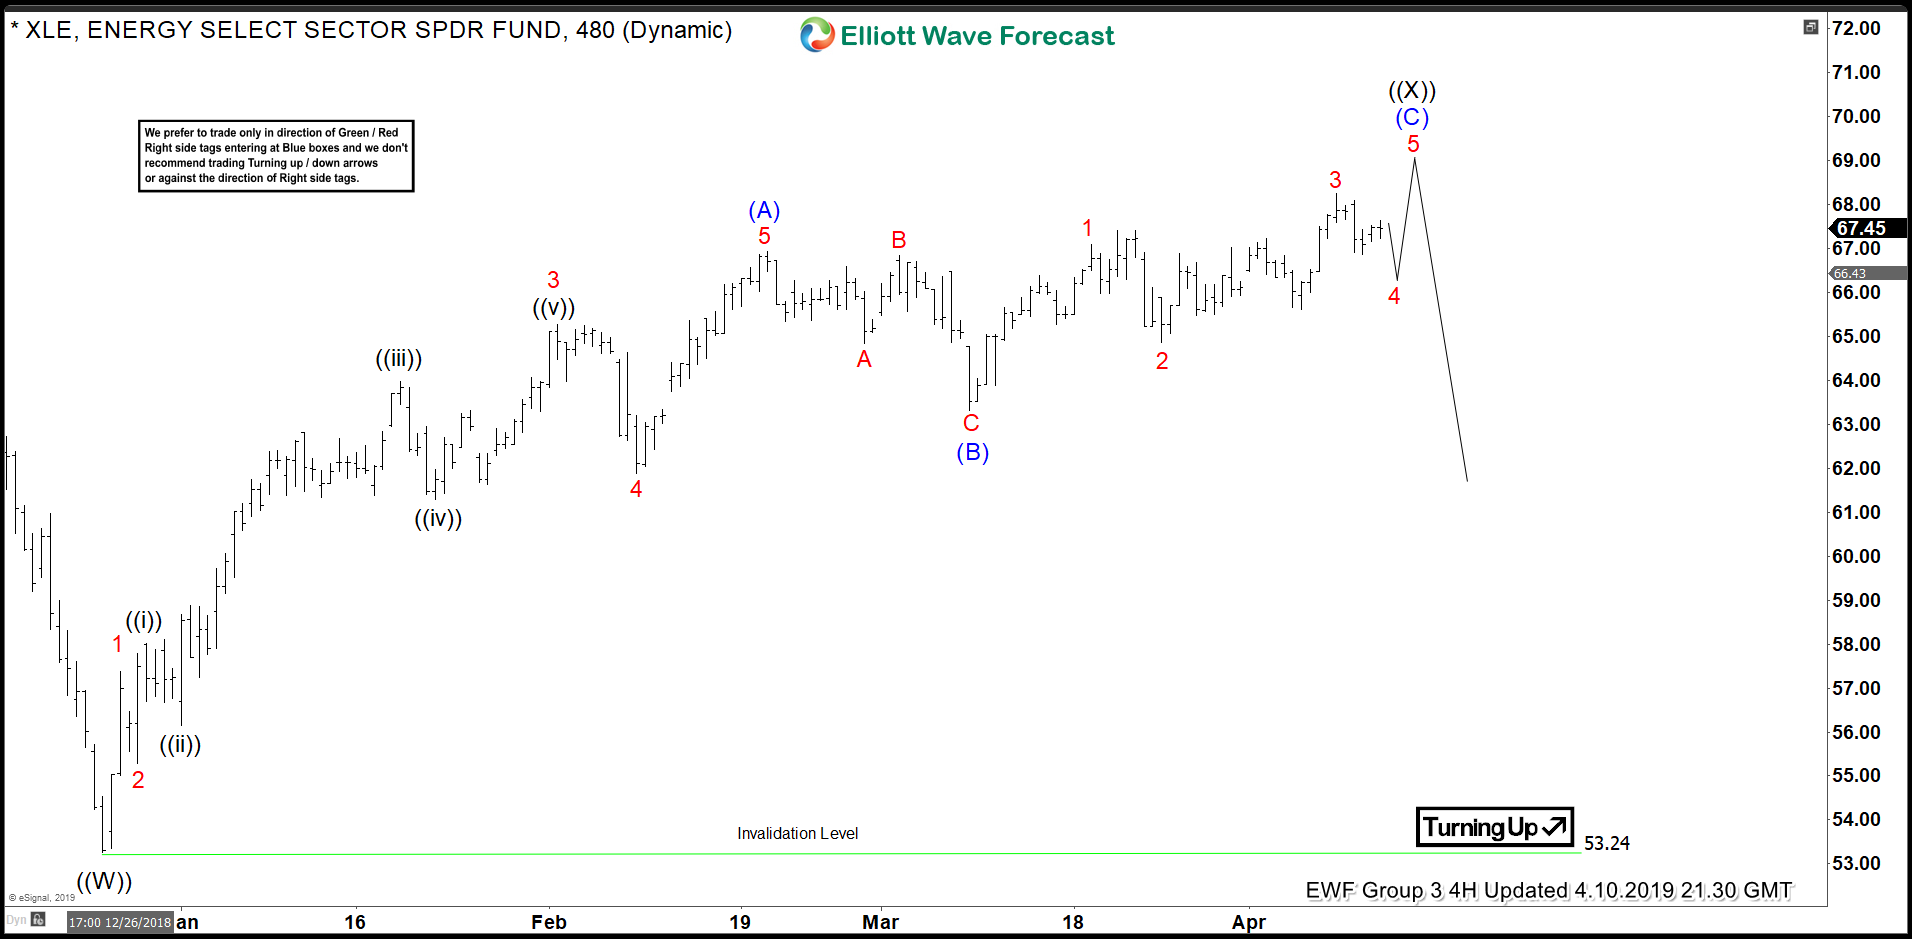
Taking a look at the recent Elliott wave structure in XLE suggests a top may be near. Starting from the 12/24/18 low at $53.25 the energy ETF shows a 5 wave impulse in wave (A) to $66.93 on 2/20/19. From there we count a 3 wave correction to the (B) wave low at $63.31 on 3/8/19. So we see 5 waves up followed by 3 back. This sequence gives a clue for practitioners of Elliott wave on what to expect next. The most likely structure playing out is that of a zigzag. This pattern is characterized by the 5-3-5 structure within its subwaves.
It is the structure from this (B) wave low that we are giving the most attention. The overlapping nature of the price action from $63.31 suggest an ending diagonal wave (C). In an ending diagonal we need 5 overlapping waves before completion. Since we only count 3 waves from the 3/8/19 low the structure has yet to be confirmed.
XLE ZigZag

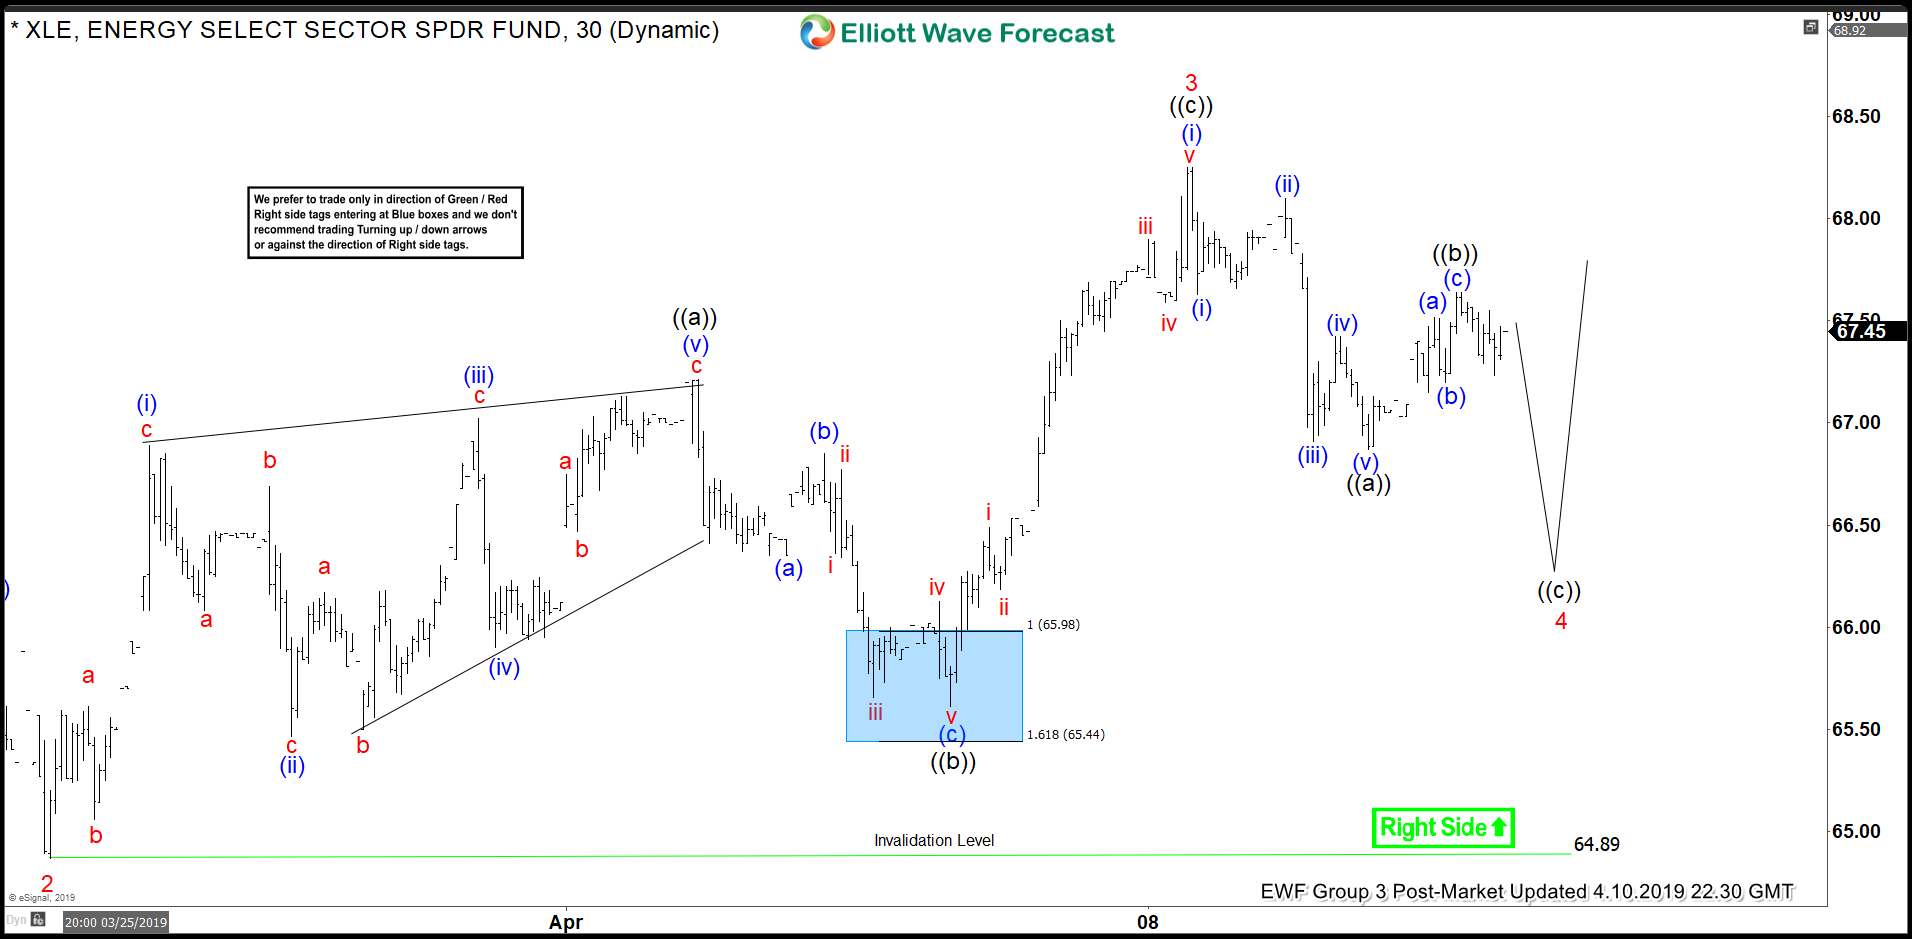
A Closer Look
Waves 1, 2, and 3 of the ending diagonal are complete and now we look for wave 4 to end above the wave 2 $64.87 low of 3/25/19. Looking at the chart below we look for wave 4 to end with one more push lower above $64.87 before turning higher for wave 5. This will be confirmed by moving above wave 3’s 4/8/19 high, $68.25. Consequently a push below $64.87 before the new high would suggest that the entire cycle from the 12/24/18 lows has ended. Let’s see how this plays out over the coming sessions.


